
|
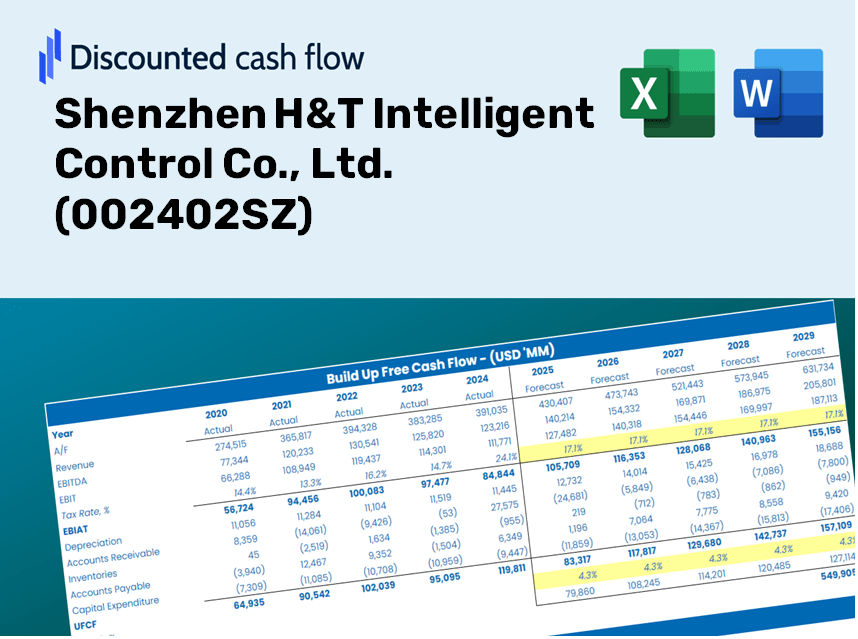
Shenzhen H&T Intelligent Control Co., Ltd. (002402.SZ) DCF Valuation |
Fully Editable: Tailor To Your Needs In Excel Or Sheets
Professional Design: Trusted, Industry-Standard Templates
Investor-Approved Valuation Models
MAC/PC Compatible, Fully Unlocked
No Expertise Is Needed; Easy To Follow
Shenzhen H&T Intelligent Control Co., Ltd. (002402.SZ) Bundle
Streamline your analysis and improve precision with our (002402SZ) DCF Calculator! Utilizing real data from Shenzhen H&T Intelligent Control Co., Ltd. and customizable assumptions, this tool empowers you to forecast, analyze, and assess the value of the company like a seasoned investor.
Discounted Cash Flow (DCF) - (USD MM)
| Year | AY1 2020 |
AY2 2021 |
AY3 2022 |
AY4 2023 |
AY5 2024 |
FY1 2025 |
FY2 2026 |
FY3 2027 |
FY4 2028 |
FY5 2029 |
|---|---|---|---|---|---|---|---|---|---|---|
| Revenue | 4,665.7 | 5,985.8 | 5,965.5 | 7,507.4 | 9,659.4 | 11,650.9 | 14,052.9 | 16,950.2 | 20,444.7 | 24,659.8 |
| Revenue Growth, % | 0 | 28.3 | -0.34037 | 25.85 | 28.66 | 20.62 | 20.62 | 20.62 | 20.62 | 20.62 |
| EBITDA | 553.0 | 699.6 | 604.1 | 537.5 | 639.0 | 1,105.5 | 1,333.4 | 1,608.3 | 1,939.9 | 2,339.8 |
| EBITDA, % | 11.85 | 11.69 | 10.13 | 7.16 | 6.61 | 9.49 | 9.49 | 9.49 | 9.49 | 9.49 |
| Depreciation | 76.3 | 106.5 | 133.8 | 192.1 | 214.6 | 243.2 | 293.4 | 353.9 | 426.9 | 514.9 |
| Depreciation, % | 1.64 | 1.78 | 2.24 | 2.56 | 2.22 | 2.09 | 2.09 | 2.09 | 2.09 | 2.09 |
| EBIT | 476.7 | 593.0 | 470.3 | 345.4 | 424.4 | 862.2 | 1,040.0 | 1,254.4 | 1,513.0 | 1,825.0 |
| EBIT, % | 10.22 | 9.91 | 7.88 | 4.6 | 4.39 | 7.4 | 7.4 | 7.4 | 7.4 | 7.4 |
| Total Cash | 1,422.7 | 1,128.3 | 1,299.1 | 1,249.1 | 1,244.8 | 2,345.2 | 2,828.7 | 3,411.9 | 4,115.3 | 4,963.8 |
| Total Cash, percent | .0 | .0 | .0 | .0 | .0 | .0 | .0 | .0 | .0 | .0 |
| Account Receivables | 1,457.4 | 1,630.1 | 1,836.1 | 2,686.9 | 3,498.0 | 3,757.4 | 4,532.1 | 5,466.5 | 6,593.5 | 7,952.9 |
| Account Receivables, % | 31.24 | 27.23 | 30.78 | 35.79 | 36.21 | 32.25 | 32.25 | 32.25 | 32.25 | 32.25 |
| Inventories | 1,044.7 | 1,537.4 | 2,088.9 | 2,119.2 | 2,376.5 | 3,167.2 | 3,820.2 | 4,607.8 | 5,557.8 | 6,703.7 |
| Inventories, % | 22.39 | 25.68 | 35.02 | 28.23 | 24.6 | 27.18 | 27.18 | 27.18 | 27.18 | 27.18 |
| Accounts Payable | 1,886.7 | 2,103.0 | 2,401.9 | 3,045.6 | 3,931.5 | 4,592.9 | 5,539.8 | 6,681.9 | 8,059.5 | 9,721.1 |
| Accounts Payable, % | 40.44 | 35.13 | 40.26 | 40.57 | 40.7 | 39.42 | 39.42 | 39.42 | 39.42 | 39.42 |
| Capital Expenditure | -289.4 | -393.3 | -375.7 | -663.6 | -830.9 | -850.8 | -1,026.2 | -1,237.8 | -1,492.9 | -1,800.7 |
| Capital Expenditure, % | -6.2 | -6.57 | -6.3 | -8.84 | -8.6 | -7.3 | -7.3 | -7.3 | -7.3 | -7.3 |
| Tax Rate, % | 0.45065 | 0.45065 | 0.45065 | 0.45065 | 0.45065 | 0.45065 | 0.45065 | 0.45065 | 0.45065 | 0.45065 |
| EBITAT | 392.4 | 492.5 | 377.9 | 320.5 | 422.5 | 755.4 | 911.1 | 1,099.0 | 1,325.6 | 1,598.8 |
| Depreciation | ||||||||||
| Changes in Account Receivables | ||||||||||
| Changes in Inventories | ||||||||||
| Changes in Accounts Payable | ||||||||||
| Capital Expenditure | ||||||||||
| UFCF | -436.0 | -243.4 | -322.7 | -388.3 | -376.4 | -241.0 | -302.4 | -364.8 | -440.0 | -530.7 |
| WACC, % | 6.81 | 6.81 | 6.81 | 6.83 | 6.83 | 6.82 | 6.82 | 6.82 | 6.82 | 6.82 |
| PV UFCF | ||||||||||
| SUM PV UFCF | -1,509.3 | |||||||||
| Long Term Growth Rate, % | 3.50 | |||||||||
| Free cash flow (T + 1) | -549 | |||||||||
| Terminal Value | -16,545 | |||||||||
| Present Terminal Value | -11,896 | |||||||||
| Enterprise Value | -13,405 | |||||||||
| Net Debt | 390 | |||||||||
| Equity Value | -13,796 | |||||||||
| Diluted Shares Outstanding, MM | 909 | |||||||||
| Equity Value Per Share | -15.18 |
Your Benefits
- Flexible Forecast Inputs: Effortlessly modify key assumptions (growth %, profit margins, WACC) to simulate various scenarios.
- Comprehensive Data: Pre-loaded financial figures from Shenzhen H&T Intelligent Control Co., Ltd. (002402SZ) to kickstart your analysis.
- Instant DCF Outputs: The template automatically computes Net Present Value (NPV) and intrinsic value for your convenience.
- Customizable and Professional Design: A sleek Excel model tailored to fit your valuation requirements.
- Designed for Analysts and Investors: Perfect for assessing projections, validating strategies, and enhancing efficiency.
Key Features
- Real-Time H&T Data: Pre-loaded with Shenzhen H&T Intelligent Control Co., Ltd.'s historical financial performance and future forecasts.
- Fully Customizable Inputs: Modify revenue growth rates, profit margins, WACC, tax percentages, and capital expenditures as needed.
- Dynamic Valuation Model: Automatically refreshes Net Present Value (NPV) and intrinsic value in response to your adjustments.
- Scenario Analysis: Generate various forecasting scenarios to explore different valuation possibilities.
- User-Friendly Interface: Designed for ease of use, catering to both professionals and newcomers alike.
How It Works
- Step 1: Download the Excel file.
- Step 2: Review Shenzhen H&T Intelligent Control Co., Ltd.'s pre-filled financial data and forecasts.
- Step 3: Adjust key inputs, such as revenue growth, WACC, and tax rates (highlighted cells).
- Step 4: Observe the DCF model update in real-time as you modify assumptions.
- Step 5: Evaluate the outputs and leverage the findings for your investment decisions.
Why Opt for This Calculator?
- User-Friendly Interface: Perfectly crafted for both novices and seasoned professionals.
- Customizable Inputs: Effortlessly adjust variables to suit your specific analysis needs.
- Real-Time Feedback: Instantly witness changes in Shenzhen H&T Intelligent Control Co., Ltd.’s (002402SZ) valuation as you modify data.
- Preloaded Data: Comes equipped with Shenzhen H&T’s actual financial information for swift evaluations.
- Industry-Endorsed: Widely utilized by investors and analysts for making well-informed choices.
Who Can Benefit from Shenzhen H&T Intelligent Control Co., Ltd. (002402SZ)?
- Investors: Make informed choices with a reliable, professional valuation tool tailored for the sector.
- Financial Analysts: Streamline your workflow with a customizable DCF model designed for efficiency.
- Consultants: Easily modify the template for impactful client presentations or detailed reports.
- Finance Enthusiasts: Enhance your knowledge of valuation methods through practical, real-world scenarios.
- Educators and Students: Utilize this tool as an effective resource in finance and investment courses.
Contents of the Template
- Operating and Balance Sheet Data: Pre-filled historical data and forecasts for Shenzhen H&T Intelligent Control Co., Ltd. (002402SZ), including revenue, EBITDA, EBIT, and capital expenditures.
- WACC Calculation: A dedicated sheet for calculating the Weighted Average Cost of Capital (WACC), featuring parameters such as Beta, risk-free rate, and share price.
- DCF Valuation (Unlevered and Levered): Customizable Discounted Cash Flow models that display intrinsic value with thorough calculations.
- Financial Statements: Pre-loaded annual and quarterly financial statements to aid in analysis.
- Key Ratios: Includes essential profitability, leverage, and efficiency ratios for Shenzhen H&T Intelligent Control Co., Ltd. (002402SZ).
- Dashboard and Charts: A visual summary of valuation outputs and assumptions designed for easier result analysis.
Disclaimer
All information, articles, and product details provided on this website are for general informational and educational purposes only. We do not claim any ownership over, nor do we intend to infringe upon, any trademarks, copyrights, logos, brand names, or other intellectual property mentioned or depicted on this site. Such intellectual property remains the property of its respective owners, and any references here are made solely for identification or informational purposes, without implying any affiliation, endorsement, or partnership.
We make no representations or warranties, express or implied, regarding the accuracy, completeness, or suitability of any content or products presented. Nothing on this website should be construed as legal, tax, investment, financial, medical, or other professional advice. In addition, no part of this site—including articles or product references—constitutes a solicitation, recommendation, endorsement, advertisement, or offer to buy or sell any securities, franchises, or other financial instruments, particularly in jurisdictions where such activity would be unlawful.
All content is of a general nature and may not address the specific circumstances of any individual or entity. It is not a substitute for professional advice or services. Any actions you take based on the information provided here are strictly at your own risk. You accept full responsibility for any decisions or outcomes arising from your use of this website and agree to release us from any liability in connection with your use of, or reliance upon, the content or products found herein.