
|
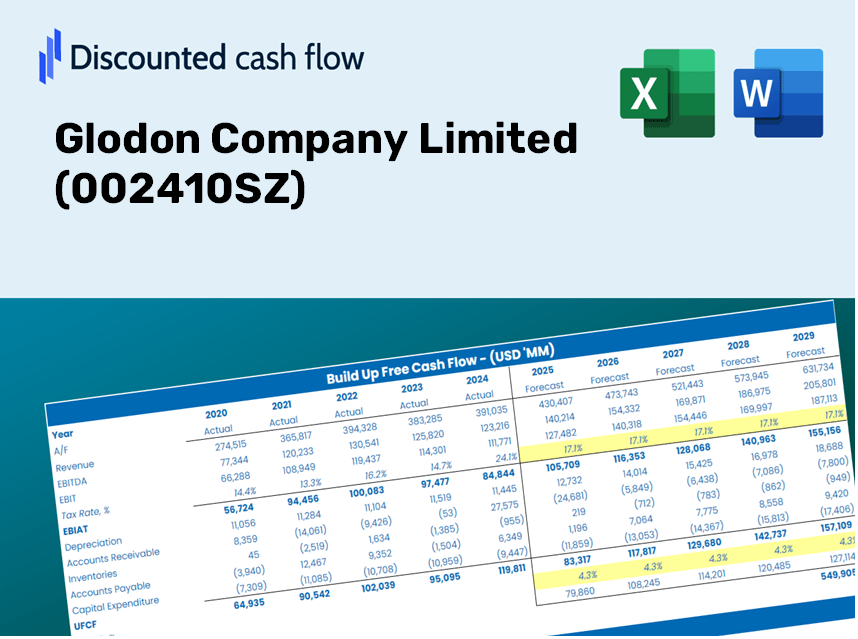
Glodon Company Limited (002410.SZ) DCF Valuation |
Fully Editable: Tailor To Your Needs In Excel Or Sheets
Professional Design: Trusted, Industry-Standard Templates
Investor-Approved Valuation Models
MAC/PC Compatible, Fully Unlocked
No Expertise Is Needed; Easy To Follow
Glodon Company Limited (002410.SZ) Bundle
Gain insights into your Glodon Company Limited (002410SZ) valuation analysis using our sophisticated DCF Calculator! This Excel template comes preloaded with real (002410SZ) data, enabling you to adjust forecasts and assumptions to accurately determine the intrinsic value of Glodon Company Limited.
Discounted Cash Flow (DCF) - (USD MM)
| Year | AY1 2020 |
AY2 2021 |
AY3 2022 |
AY4 2023 |
AY5 2024 |
FY1 2025 |
FY2 2026 |
FY3 2027 |
FY4 2028 |
FY5 2029 |
|---|---|---|---|---|---|---|---|---|---|---|
| Revenue | 3,954.3 | 5,583.2 | 6,564.6 | 6,546.1 | 6,220.1 | 6,502.4 | 6,797.6 | 7,106.2 | 7,428.8 | 7,766.1 |
| Revenue Growth, % | 0 | 41.19 | 17.58 | -0.28242 | -4.98 | 4.54 | 4.54 | 4.54 | 4.54 | 4.54 |
| EBITDA | 485.4 | 825.2 | 1,206.1 | 612.3 | 379.3 | 791.7 | 827.7 | 865.3 | 904.5 | 945.6 |
| EBITDA, % | 12.28 | 14.78 | 18.37 | 9.35 | 6.1 | 12.18 | 12.18 | 12.18 | 12.18 | 12.18 |
| Depreciation | 127.8 | 153.0 | 215.5 | 404.8 | 120.2 | 225.9 | 236.2 | 246.9 | 258.1 | 269.8 |
| Depreciation, % | 3.23 | 2.74 | 3.28 | 6.18 | 1.93 | 3.47 | 3.47 | 3.47 | 3.47 | 3.47 |
| EBIT | 357.6 | 672.2 | 990.6 | 207.5 | 259.1 | 565.8 | 591.5 | 618.4 | 646.4 | 675.8 |
| EBIT, % | 9.04 | 12.04 | 15.09 | 3.17 | 4.17 | 8.7 | 8.7 | 8.7 | 8.7 | 8.7 |
| Total Cash | 4,796.9 | 4,049.5 | 4,344.5 | 3,786.8 | 3,935.3 | 4,679.5 | 4,891.9 | 5,114.0 | 5,346.2 | 5,588.9 |
| Total Cash, percent | .0 | .0 | .0 | .0 | .0 | .0 | .0 | .0 | .0 | .0 |
| Account Receivables | 513.4 | 629.4 | 1,086.7 | 858.8 | 862.5 | 881.7 | 921.7 | 963.5 | 1,007.3 | 1,053.0 |
| Account Receivables, % | 12.98 | 11.27 | 16.55 | 13.12 | 13.87 | 13.56 | 13.56 | 13.56 | 13.56 | 13.56 |
| Inventories | 26.3 | 70.9 | 86.6 | 48.9 | 49.6 | 62.4 | 65.2 | 68.2 | 71.3 | 74.5 |
| Inventories, % | 0.66577 | 1.27 | 1.32 | 0.74708 | 0.79673 | 0.9597 | 0.9597 | 0.9597 | 0.9597 | 0.9597 |
| Accounts Payable | 95.0 | 268.0 | 545.8 | 406.4 | 527.3 | 392.8 | 410.6 | 429.2 | 448.7 | 469.1 |
| Accounts Payable, % | 2.4 | 4.8 | 8.31 | 6.21 | 8.48 | 6.04 | 6.04 | 6.04 | 6.04 | 6.04 |
| Capital Expenditure | -439.1 | -720.4 | -849.5 | -611.1 | -437.3 | -693.3 | -724.8 | -757.7 | -792.1 | -828.1 |
| Capital Expenditure, % | -11.1 | -12.9 | -12.94 | -9.33 | -7.03 | -10.66 | -10.66 | -10.66 | -10.66 | -10.66 |
| Tax Rate, % | 19.13 | 19.13 | 19.13 | 19.13 | 19.13 | 19.13 | 19.13 | 19.13 | 19.13 | 19.13 |
| EBITAT | 287.9 | 593.0 | 870.7 | 159.8 | 209.5 | 469.1 | 490.4 | 512.6 | 535.9 | 560.2 |
| Depreciation | ||||||||||
| Changes in Account Receivables | ||||||||||
| Changes in Inventories | ||||||||||
| Changes in Accounts Payable | ||||||||||
| Capital Expenditure | ||||||||||
| UFCF | -468.0 | 37.9 | 41.4 | 79.8 | 9.0 | -164.8 | -23.3 | -24.3 | -25.4 | -26.6 |
| WACC, % | 8.24 | 8.24 | 8.24 | 8.24 | 8.24 | 8.24 | 8.24 | 8.24 | 8.24 | 8.24 |
| PV UFCF | ||||||||||
| SUM PV UFCF | -227.7 | |||||||||
| Long Term Growth Rate, % | 3.50 | |||||||||
| Free cash flow (T + 1) | -28 | |||||||||
| Terminal Value | -580 | |||||||||
| Present Terminal Value | -391 | |||||||||
| Enterprise Value | -618 | |||||||||
| Net Debt | -3,870 | |||||||||
| Equity Value | 3,252 | |||||||||
| Diluted Shares Outstanding, MM | 1,655 | |||||||||
| Equity Value Per Share | 1.96 |
Benefits You Will Receive
- Authentic Glodon Data: Comprehensive financials – from revenue to EBIT – derived from real and forecasted figures.
- Complete Customization: Modify essential parameters (yellow cells) such as WACC, growth %, and tax rates as needed.
- Real-Time Valuation Updates: Automated recalculations to assess the effect of adjustments on Glodon's fair value.
- Flexible Excel Template: Designed for easy modifications, scenario analysis, and in-depth projections.
- Efficient and Precise: Eliminate the need to construct models from scratch while ensuring accuracy and adaptability.
Key Features of Glodon Company Limited (002410SZ)
- Accurate Financial Data: Gain access to reliable pre-loaded historical data and future forecasts specific to Glodon Company.
- Customizable Assumptions: Modify highlighted cells to adjust key variables such as WACC, growth rates, and profit margins.
- Real-Time Calculations: Experience automatic updates for DCF, Net Present Value (NPV), and cash flow metrics.
- User-Friendly Dashboard: Utilize intuitive charts and summaries that clearly represent your valuation findings.
- Suitable for All Skill Levels: Designed with simplicity in mind for investors, CFOs, and consultants alike.
How It Functions
- 1. Access the Template: Download and open the Excel file containing Glodon Company Limited’s preloaded data.
- 2. Modify Assumptions: Adjust essential inputs such as growth projections, WACC, and capital expenditures.
- 3. View Results Instantly: The DCF model automatically computes the intrinsic value and NPV.
- 4. Explore Scenarios: Evaluate various forecasts to examine different valuation results.
- 5. Present with Confidence: Share professional valuation analysis to reinforce your decision-making process.
Why Choose This Calculator for Glodon Company Limited (002410SZ)?
- User-Friendly Interface: Tailored for both novices and experienced users.
- Customizable Inputs: Effortlessly adjust assumptions to fit your specific analysis.
- Real-Time Valuation: Observe immediate changes in Glodon’s valuation as you modify inputs.
- Pre-Configured Data: Comes equipped with Glodon’s actual financial metrics for prompt assessments.
- Favored by Experts: Trusted by investors and analysts for making well-informed choices.
Who Should Use This Product?
- Finance Students: Master valuation techniques and apply them using actual data.
- Academics: Integrate professional models into your courses or research endeavors.
- Investors: Challenge your own assumptions and evaluate valuation results for Glodon Company Limited (002410SZ).
- Analysts: Enhance your efficiency with a pre-built, customizable DCF model tailored for Glodon.
- Small Business Owners: Discover how large publicly traded companies, like Glodon Company Limited (002410SZ), are assessed and valued.
Contents of the Template
- Preloaded GD Data: Historical and forecasted financial metrics, including revenue, EBIT, and capital expenditures.
- DCF and WACC Models: Advanced worksheets designed for estimating intrinsic value and the Weighted Average Cost of Capital.
- Editable Inputs: Cells highlighted in yellow for customizing revenue growth rates, tax rates, and discount rates.
- Financial Statements: Detailed annual and quarterly financial reports for in-depth analysis.
- Key Ratios: Ratios for profitability, leverage, and efficiency to assess overall performance.
- Dashboard and Charts: Visual representations of valuation results and underlying assumptions.
Disclaimer
All information, articles, and product details provided on this website are for general informational and educational purposes only. We do not claim any ownership over, nor do we intend to infringe upon, any trademarks, copyrights, logos, brand names, or other intellectual property mentioned or depicted on this site. Such intellectual property remains the property of its respective owners, and any references here are made solely for identification or informational purposes, without implying any affiliation, endorsement, or partnership.
We make no representations or warranties, express or implied, regarding the accuracy, completeness, or suitability of any content or products presented. Nothing on this website should be construed as legal, tax, investment, financial, medical, or other professional advice. In addition, no part of this site—including articles or product references—constitutes a solicitation, recommendation, endorsement, advertisement, or offer to buy or sell any securities, franchises, or other financial instruments, particularly in jurisdictions where such activity would be unlawful.
All content is of a general nature and may not address the specific circumstances of any individual or entity. It is not a substitute for professional advice or services. Any actions you take based on the information provided here are strictly at your own risk. You accept full responsibility for any decisions or outcomes arising from your use of this website and agree to release us from any liability in connection with your use of, or reliance upon, the content or products found herein.