
|
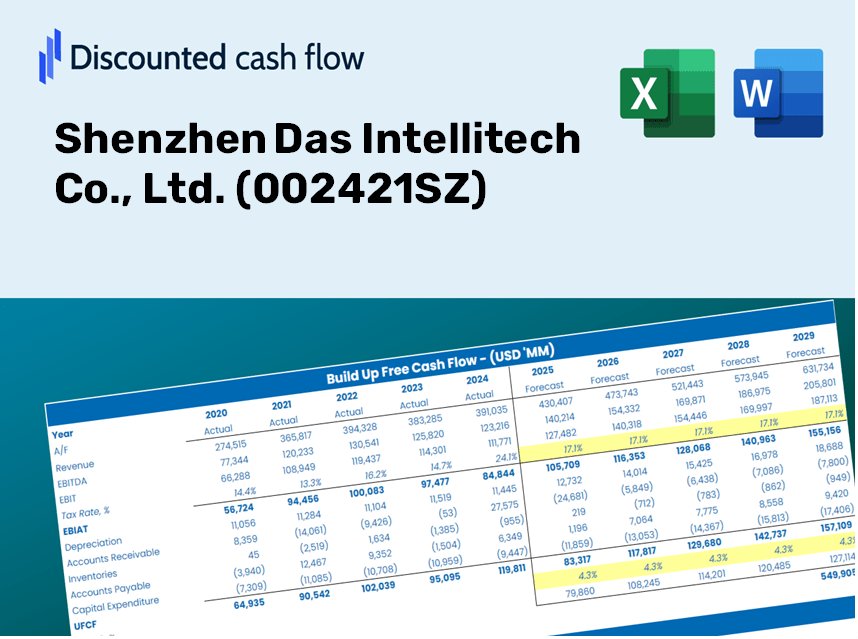
Shenzhen Das Intellitech Co., Ltd. (002421.SZ) DCF Valuation |
Fully Editable: Tailor To Your Needs In Excel Or Sheets
Professional Design: Trusted, Industry-Standard Templates
Investor-Approved Valuation Models
MAC/PC Compatible, Fully Unlocked
No Expertise Is Needed; Easy To Follow
Shenzhen Das Intellitech Co., Ltd. (002421.SZ) Bundle
Evaluate Shenzhen Das Intellitech Co., Ltd. (002421SZ) financial outlook with professionalism! This (002421SZ) DCF Calculator provides pre-filled financial data and full flexibility to modify revenue growth, WACC, margins, and other critical assumptions to align with your predictions.
Discounted Cash Flow (DCF) - (USD MM)
| Year | AY1 2020 |
AY2 2021 |
AY3 2022 |
AY4 2023 |
AY5 2024 |
FY1 2025 |
FY2 2026 |
FY3 2027 |
FY4 2028 |
FY5 2029 |
|---|---|---|---|---|---|---|---|---|---|---|
| Revenue | 3,211.0 | 3,164.0 | 3,594.3 | 3,833.1 | 3,170.8 | 3,182.8 | 3,194.7 | 3,206.7 | 3,218.8 | 3,230.9 |
| Revenue Growth, % | 0 | -1.46 | 13.6 | 6.64 | -17.28 | 0.37577 | 0.37577 | 0.37577 | 0.37577 | 0.37577 |
| EBITDA | 505.9 | -47.5 | 246.2 | 338.2 | 296.8 | 250.1 | 251.0 | 252.0 | 252.9 | 253.9 |
| EBITDA, % | 15.76 | -1.5 | 6.85 | 8.82 | 9.36 | 7.86 | 7.86 | 7.86 | 7.86 | 7.86 |
| Depreciation | 119.8 | 129.3 | 127.2 | 219.9 | 210.8 | 151.1 | 151.7 | 152.3 | 152.8 | 153.4 |
| Depreciation, % | 3.73 | 4.09 | 3.54 | 5.74 | 6.65 | 4.75 | 4.75 | 4.75 | 4.75 | 4.75 |
| EBIT | 386.1 | -176.8 | 119.0 | 118.3 | 86.0 | 99.0 | 99.3 | 99.7 | 100.1 | 100.5 |
| EBIT, % | 12.02 | -5.59 | 3.31 | 3.09 | 2.71 | 3.11 | 3.11 | 3.11 | 3.11 | 3.11 |
| Total Cash | 1,324.5 | 1,402.6 | 1,673.0 | 1,729.9 | 1,629.9 | 1,455.5 | 1,461.0 | 1,466.5 | 1,472.0 | 1,477.5 |
| Total Cash, percent | .0 | .0 | .0 | .0 | .0 | .0 | .0 | .0 | .0 | .0 |
| Account Receivables | 3,037.8 | 2,502.3 | 2,745.1 | 2,967.6 | 3,316.3 | 2,721.2 | 2,731.4 | 2,741.7 | 2,752.0 | 2,762.3 |
| Account Receivables, % | 94.61 | 79.09 | 76.37 | 77.42 | 104.59 | 85.5 | 85.5 | 85.5 | 85.5 | 85.5 |
| Inventories | 433.7 | 502.7 | 477.3 | 355.4 | 316.4 | 394.2 | 395.7 | 397.1 | 398.6 | 400.1 |
| Inventories, % | 13.51 | 15.89 | 13.28 | 9.27 | 9.98 | 12.38 | 12.38 | 12.38 | 12.38 | 12.38 |
| Accounts Payable | 1,791.9 | 1,937.1 | 2,220.6 | 1,931.0 | 2,274.9 | 1,915.6 | 1,922.8 | 1,930.0 | 1,937.2 | 1,944.5 |
| Accounts Payable, % | 55.81 | 61.22 | 61.78 | 50.38 | 71.74 | 60.19 | 60.19 | 60.19 | 60.19 | 60.19 |
| Capital Expenditure | -588.4 | -739.6 | -482.0 | -426.9 | -256.0 | -473.1 | -474.9 | -476.7 | -478.5 | -480.3 |
| Capital Expenditure, % | -18.33 | -23.38 | -13.41 | -11.14 | -8.07 | -14.86 | -14.86 | -14.86 | -14.86 | -14.86 |
| Tax Rate, % | 4.75 | 4.75 | 4.75 | 4.75 | 4.75 | 4.75 | 4.75 | 4.75 | 4.75 | 4.75 |
| EBITAT | 339.9 | -168.0 | 102.3 | 118.0 | 81.9 | 91.9 | 92.2 | 92.5 | 92.9 | 93.2 |
| Depreciation | ||||||||||
| Changes in Account Receivables | ||||||||||
| Changes in Inventories | ||||||||||
| Changes in Accounts Payable | ||||||||||
| Capital Expenditure | ||||||||||
| UFCF | -1,808.4 | -166.7 | -186.3 | -479.2 | 70.9 | -72.0 | -235.5 | -236.4 | -237.3 | -238.2 |
| WACC, % | 4.58 | 4.68 | 4.55 | 4.75 | 4.68 | 4.65 | 4.65 | 4.65 | 4.65 | 4.65 |
| PV UFCF | ||||||||||
| SUM PV UFCF | -877.7 | |||||||||
| Long Term Growth Rate, % | 4.00 | |||||||||
| Free cash flow (T + 1) | -248 | |||||||||
| Terminal Value | -38,141 | |||||||||
| Present Terminal Value | -30,388 | |||||||||
| Enterprise Value | -31,266 | |||||||||
| Net Debt | 1,154 | |||||||||
| Equity Value | -32,420 | |||||||||
| Diluted Shares Outstanding, MM | 2,121 | |||||||||
| Equity Value Per Share | -15.28 |
What You Will Receive
- Customizable Excel Template: An adaptable Excel-based DCF Calculator featuring pre-filled financial data for Shenzhen Das Intellitech Co., Ltd. (002421SZ).
- Comprehensive Data: Access to historical performance metrics and forward-looking projections (highlighted in the yellow cells).
- Flexible Forecasting: Modify key assumptions such as revenue growth, EBITDA margin, and WACC.
- Instant Calculations: Quickly observe how your inputs affect the valuation of Shenzhen Das Intellitech Co., Ltd. (002421SZ).
- Professional-grade Tool: Designed for investors, CFOs, consultants, and financial analysts.
- User-Centric Layout: Organized for ease of understanding and navigation, complete with step-by-step guidance.
Key Features
- Comprehensive Historical Data: Access Shenzhen Das Intellitech Co., Ltd.'s (002421SZ) past financial records and projected forecasts.
- Customizable Parameters: Adjust WACC, tax rates, revenue growth, and EBITDA margins to fit your analysis.
- Real-Time Insights: Watch the intrinsic value of Shenzhen Das Intellitech Co., Ltd. (002421SZ) update instantly.
- Intuitive Visual Representations: Dashboard graphs highlight valuation results and essential metrics.
- Precision-Driven Tools: Designed for analysts, investors, and finance professionals seeking accuracy.
How It Works
- Step 1: Download the Excel file for Shenzhen Das Intellitech Co., Ltd. (002421SZ).
- Step 2: Examine the pre-populated financial data and forecasts for (002421SZ).
- Step 3: Adjust key inputs such as revenue growth, WACC, and tax rates (highlighted cells).
- Step 4: Observe the DCF model update in real-time as you modify your assumptions.
- Step 5: Evaluate the outputs and leverage the findings for investment strategies.
Why Choose This Calculator for Shenzhen Das Intellitech Co., Ltd. (002421SZ)?
- Precise Data: Leveraging authentic financials from Shenzhen Das Intellitech ensures trustworthy valuation outcomes.
- Personalizable: Modify essential parameters such as growth rates, WACC, and tax rates to align with your forecasts.
- Efficiency Boost: Built-in calculations save you from starting from the ground up.
- Professional-Quality Tool: Tailored for investors, analysts, and consulting professionals.
- Easy to Use: Clear design and step-by-step guidance make it accessible for all users.
Who Can Benefit from This Product?
- Finance Students: Master valuation techniques and practice with real-world data from (002421SZ).
- Academics: Integrate advanced models into your courses or research focused on (002421SZ).
- Investors: Challenge your assumptions and evaluate valuation results for stocks like (002421SZ).
- Analysts: Enhance your efficiency with a customizable DCF model tailored for (002421SZ).
- Small Business Owners: Discover how large corporations like (002421SZ) are analyzed in the market.
Contents of the Template
- Preloaded 002421SZ Data: Historical and forecasted financial information, including revenue, EBIT, and capital expenditures.
- DCF and WACC Models: Advanced spreadsheets for determining intrinsic value and Weighted Average Cost of Capital.
- Editable Inputs: Cells highlighted in yellow for modifying revenue growth, tax rates, and discount rates.
- Financial Statements: Detailed annual and quarterly financials for thorough analysis.
- Key Ratios: Metrics on profitability, leverage, and efficiency for performance assessment.
- Dashboard and Charts: Visual representations of valuation results and underlying assumptions.
Disclaimer
All information, articles, and product details provided on this website are for general informational and educational purposes only. We do not claim any ownership over, nor do we intend to infringe upon, any trademarks, copyrights, logos, brand names, or other intellectual property mentioned or depicted on this site. Such intellectual property remains the property of its respective owners, and any references here are made solely for identification or informational purposes, without implying any affiliation, endorsement, or partnership.
We make no representations or warranties, express or implied, regarding the accuracy, completeness, or suitability of any content or products presented. Nothing on this website should be construed as legal, tax, investment, financial, medical, or other professional advice. In addition, no part of this site—including articles or product references—constitutes a solicitation, recommendation, endorsement, advertisement, or offer to buy or sell any securities, franchises, or other financial instruments, particularly in jurisdictions where such activity would be unlawful.
All content is of a general nature and may not address the specific circumstances of any individual or entity. It is not a substitute for professional advice or services. Any actions you take based on the information provided here are strictly at your own risk. You accept full responsibility for any decisions or outcomes arising from your use of this website and agree to release us from any liability in connection with your use of, or reliance upon, the content or products found herein.