
|
Zhejiang Wanliyang Co., Ltd. (002434.SZ) DCF Valuation |
Fully Editable: Tailor To Your Needs In Excel Or Sheets
Professional Design: Trusted, Industry-Standard Templates
Investor-Approved Valuation Models
MAC/PC Compatible, Fully Unlocked
No Expertise Is Needed; Easy To Follow
Zhejiang Wanliyang Co., Ltd. (002434.SZ) Bundle
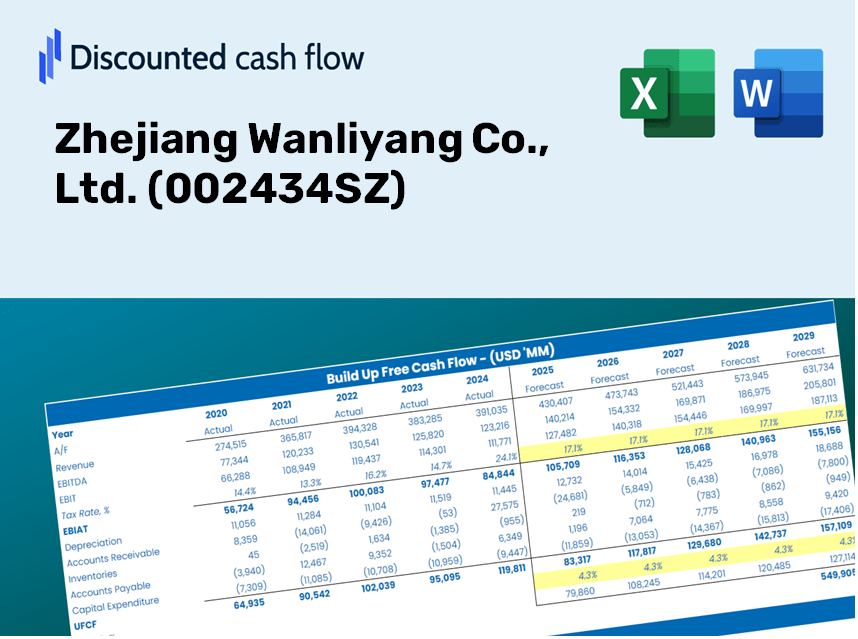
Gain insights into your Zhejiang Wanliyang Co., Ltd. (002434SZ) valuation analysis using our cutting-edge DCF Calculator! This Excel template comes preloaded with accurate (002434SZ) data, enabling you to adjust forecasts and assumptions to determine the intrinsic value of Zhejiang Wanliyang Co., Ltd. with precision.
Discounted Cash Flow (DCF) - (USD MM)
| Year | AY1 2020 |
AY2 2021 |
AY3 2022 |
AY4 2023 |
AY5 2024 |
FY1 2025 |
FY2 2026 |
FY3 2027 |
FY4 2028 |
FY5 2029 |
|---|---|---|---|---|---|---|---|---|---|---|
| Revenue | 6,064.9 | 5,486.8 | 5,113.1 | 5,912.8 | 6,012.8 | 6,027.7 | 6,042.6 | 6,057.5 | 6,072.5 | 6,087.5 |
| Revenue Growth, % | 0 | -9.53 | -6.81 | 15.64 | 1.69 | 0.24722 | 0.24722 | 0.24722 | 0.24722 | 0.24722 |
| EBITDA | 989.5 | 680.1 | 608.0 | 790.7 | 818.9 | 814.9 | 816.9 | 818.9 | 820.9 | 822.9 |
| EBITDA, % | 16.32 | 12.39 | 11.89 | 13.37 | 13.62 | 13.52 | 13.52 | 13.52 | 13.52 | 13.52 |
| Depreciation | 458.4 | 515.4 | 433.9 | 441.4 | 488.6 | 494.6 | 495.8 | 497.1 | 498.3 | 499.5 |
| Depreciation, % | 7.56 | 9.39 | 8.49 | 7.47 | 8.13 | 8.21 | 8.21 | 8.21 | 8.21 | 8.21 |
| EBIT | 531.1 | 164.6 | 174.1 | 349.3 | 330.3 | 320.2 | 321.0 | 321.8 | 322.6 | 323.4 |
| EBIT, % | 8.76 | 3 | 3.4 | 5.91 | 5.49 | 5.31 | 5.31 | 5.31 | 5.31 | 5.31 |
| Total Cash | 1,152.7 | 877.8 | 685.7 | 928.0 | 731.8 | 919.6 | 921.9 | 924.1 | 926.4 | 928.7 |
| Total Cash, percent | .0 | .0 | .0 | .0 | .0 | .0 | .0 | .0 | .0 | .0 |
| Account Receivables | 2,558.9 | 2,628.9 | 2,658.2 | 2,254.0 | 1,859.9 | 2,545.5 | 2,551.8 | 2,558.1 | 2,564.4 | 2,570.7 |
| Account Receivables, % | 42.19 | 47.91 | 51.99 | 38.12 | 30.93 | 42.23 | 42.23 | 42.23 | 42.23 | 42.23 |
| Inventories | 864.8 | 932.9 | 882.8 | 980.4 | 1,099.1 | 1,005.3 | 1,007.7 | 1,010.2 | 1,012.7 | 1,015.2 |
| Inventories, % | 14.26 | 17 | 17.27 | 16.58 | 18.28 | 16.68 | 16.68 | 16.68 | 16.68 | 16.68 |
| Accounts Payable | 2,756.6 | 2,286.6 | 2,397.3 | 1,386.3 | 1,885.4 | 2,276.2 | 2,281.9 | 2,287.5 | 2,293.2 | 2,298.8 |
| Accounts Payable, % | 45.45 | 41.68 | 46.89 | 23.45 | 31.36 | 37.76 | 37.76 | 37.76 | 37.76 | 37.76 |
| Capital Expenditure | -314.8 | -64.9 | -247.9 | -424.7 | -542.3 | -330.6 | -331.4 | -332.2 | -333.0 | -333.9 |
| Capital Expenditure, % | -5.19 | -1.18 | -4.85 | -7.18 | -9.02 | -5.48 | -5.48 | -5.48 | -5.48 | -5.48 |
| Tax Rate, % | 15.26 | 15.26 | 15.26 | 15.26 | 15.26 | 15.26 | 15.26 | 15.26 | 15.26 | 15.26 |
| EBITAT | 489.7 | 163.0 | 174.7 | 329.8 | 279.9 | 301.3 | 302.0 | 302.8 | 303.5 | 304.3 |
| Depreciation | ||||||||||
| Changes in Account Receivables | ||||||||||
| Changes in Inventories | ||||||||||
| Changes in Accounts Payable | ||||||||||
| Capital Expenditure | ||||||||||
| UFCF | -33.8 | 5.4 | 492.1 | -357.8 | 1,000.8 | 264.4 | 463.3 | 464.4 | 465.6 | 466.7 |
| WACC, % | 6.58 | 6.61 | 6.62 | 6.59 | 6.54 | 6.59 | 6.59 | 6.59 | 6.59 | 6.59 |
| PV UFCF | ||||||||||
| SUM PV UFCF | 1,739.5 | |||||||||
| Long Term Growth Rate, % | 2.00 | |||||||||
| Free cash flow (T + 1) | 476 | |||||||||
| Terminal Value | 10,382 | |||||||||
| Present Terminal Value | 7,547 | |||||||||
| Enterprise Value | 9,287 | |||||||||
| Net Debt | 1,296 | |||||||||
| Equity Value | 7,991 | |||||||||
| Diluted Shares Outstanding, MM | 1,333 | |||||||||
| Equity Value Per Share | 5.99 |
What You Will Receive
- Authentic Zhejiang Wanliyang Financials: Access to historical and projected data for precise valuation.
- Customizable Inputs: Tailor WACC, tax rates, revenue growth, and capital expenditures to your needs.
- Automated Calculations: Dynamic calculations for intrinsic value and NPV.
- Scenario Analysis: Evaluate various scenarios to assess the future outlook of Zhejiang Wanliyang.
- User-Friendly and Professional Design: Designed for industry experts while remaining approachable for newcomers.
Key Features
- Comprehensive Historical Data: Access Zhejiang Wanliyang Co., Ltd.'s (002434SZ) detailed financial statements and pre-populated forecasts.
- Customizable Parameters: Modify WACC, tax rates, revenue growth, and EBITDA margins as needed.
- Real-Time Calculations: Instantly view the intrinsic value of Zhejiang Wanliyang Co., Ltd. (002434SZ) as it updates live.
- Intuitive Visual Representations: Dashboard graphs illustrate valuation outcomes and essential metrics clearly.
- Precision Engineered: Designed as a reliable tool for analysts, investors, and financial professionals.
How It Works
- 1. Access the Template: Download and open the Excel template featuring Zhejiang Wanliyang Co., Ltd.'s preloaded data.
- 2. Adjust Assumptions: Modify key parameters such as growth expectations, WACC, and capital expenditures.
- 3. See Results Immediately: The DCF model automatically computes intrinsic value and NPV based on your inputs.
- 4. Explore Scenarios: Evaluate various forecasts to assess different valuation outcomes.
- 5. Present with Assurance: Deliver professional valuation analyses to bolster your decision-making process.
Why Opt for This Calculator?
- All-in-One Solution: Combines DCF, WACC, and financial ratio analyses for comprehensive evaluations.
- Adjustable Parameters: Modify the yellow-highlighted cells to explore different scenarios.
- In-Depth Analysis: Automatically computes the intrinsic value and Net Present Value of Zhejiang Wanliyang Co., Ltd. (002434SZ).
- Included Data: Access to historical and projected data provides reliable starting points for analysis.
- High Standards: Suited for financial analysts, investors, and business consultants seeking professional-grade tools.
Who Can Benefit from This Product?
- Investors: Accurately assess the fair value of Zhejiang Wanliyang Co., Ltd. (002434SZ) before making investment choices.
- CFOs: Utilize a professional-grade DCF model for comprehensive financial reporting and analysis.
- Consultants: Easily customize the template for valuation reports tailored to your clients' needs.
- Entrepreneurs: Acquire valuable insights into financial modeling practices employed by leading companies.
- Educators: Implement it as a teaching aid to illustrate various valuation methodologies.
Overview of Template Features
- Preloaded ZJW Data: Historical and projected financial figures, encompassing revenue, EBIT, and capital investments.
- DCF and WACC Models: Advanced spreadsheets for determining intrinsic value and calculating the Weighted Average Cost of Capital.
- Editable Inputs: Cells highlighted in yellow for easy adjustments of revenue growth rates, tax policies, and discount rates.
- Financial Statements: Detailed annual and quarterly financial reports for in-depth analysis.
- Key Ratios: Metrics on profitability, leverage, and efficiency to assess performance effectively.
- Dashboard and Charts: Visual representations of valuation results and underlying assumptions.
Disclaimer
All information, articles, and product details provided on this website are for general informational and educational purposes only. We do not claim any ownership over, nor do we intend to infringe upon, any trademarks, copyrights, logos, brand names, or other intellectual property mentioned or depicted on this site. Such intellectual property remains the property of its respective owners, and any references here are made solely for identification or informational purposes, without implying any affiliation, endorsement, or partnership.
We make no representations or warranties, express or implied, regarding the accuracy, completeness, or suitability of any content or products presented. Nothing on this website should be construed as legal, tax, investment, financial, medical, or other professional advice. In addition, no part of this site—including articles or product references—constitutes a solicitation, recommendation, endorsement, advertisement, or offer to buy or sell any securities, franchises, or other financial instruments, particularly in jurisdictions where such activity would be unlawful.
All content is of a general nature and may not address the specific circumstances of any individual or entity. It is not a substitute for professional advice or services. Any actions you take based on the information provided here are strictly at your own risk. You accept full responsibility for any decisions or outcomes arising from your use of this website and agree to release us from any liability in connection with your use of, or reliance upon, the content or products found herein.