
|
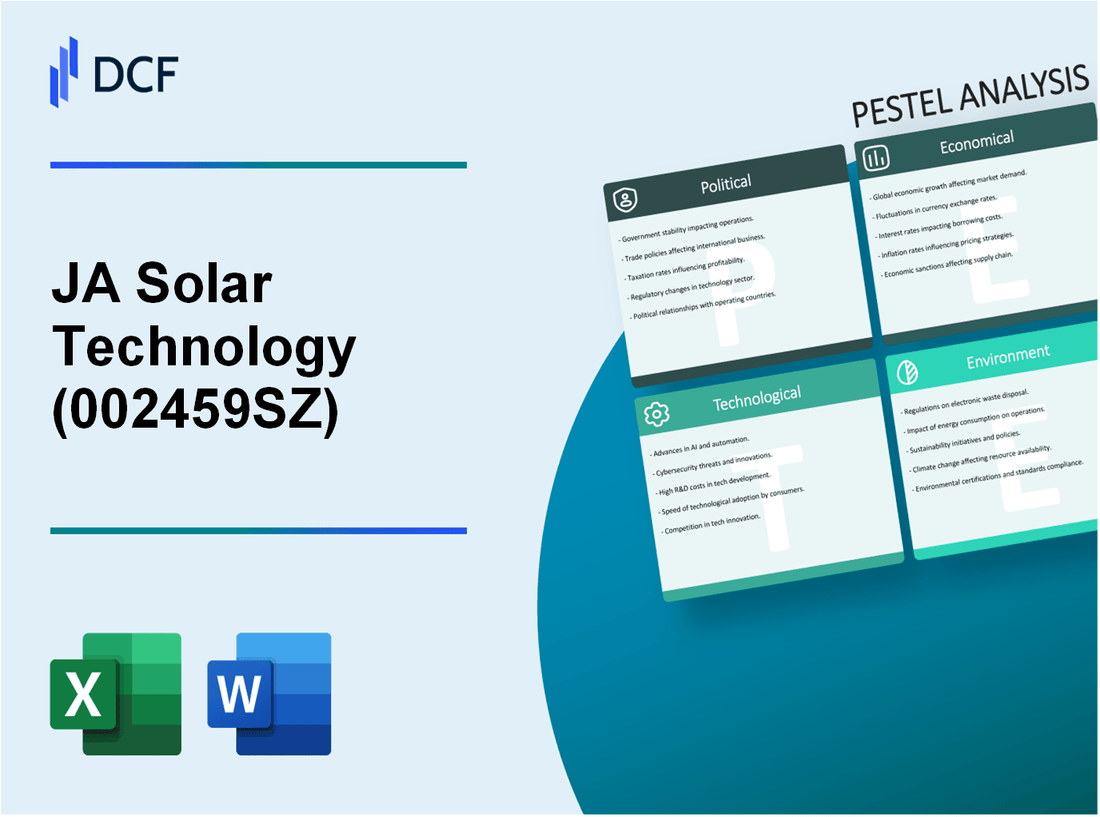
JA Solar Technology Co., Ltd. (002459.SZ): PESTEL Analysis |
Fully Editable: Tailor To Your Needs In Excel Or Sheets
Professional Design: Trusted, Industry-Standard Templates
Investor-Approved Valuation Models
MAC/PC Compatible, Fully Unlocked
No Expertise Is Needed; Easy To Follow
JA Solar Technology Co., Ltd. (002459.SZ) Bundle
As the world pivots towards sustainability, JA Solar Technology Co., Ltd. stands at the forefront of the solar energy revolution. This PESTLE analysis unpacks the multifaceted forces shaping JA Solar's business landscape—from government incentives and economic trends to technological innovations and environmental impacts. Dive in to discover how these elements interweave to influence the future of solar energy and the dynamics of a company poised for growth.
JA Solar Technology Co., Ltd. - PESTLE Analysis: Political factors
JA Solar Technology Co., Ltd. operates in a complex political landscape that significantly influences its business operations. The following political factors are essential to understanding the company's environment.
Government incentives for renewable energy
In 2023, the Chinese government continued to provide substantial support for the solar industry. For instance, the National Energy Administration announced a target of 50 GW of new solar capacity installations for the year, backed by subsidies that include direct financial incentives and tax benefits. The Chinese government also implemented policies such as feed-in tariffs, which guarantee a fixed price for solar energy fed back into the grid, thus promoting investment in photovoltaics (PV) technology.
Trade policies affecting solar exports
JA Solar has faced challenges due to trade policies, particularly in key markets like the United States. The U.S. imposed tariffs of up to 25% on solar panels imported from China, affecting pricing strategies and competitiveness. In response to the tariffs, JA Solar has explored alternative supply chain options, including partnerships with manufacturers in Southeast Asia, allowing it to circumvent some trade restrictions.
International relations impacting supply chain
Geopolitical tensions between the U.S. and China have raised concerns over supply chain sustainability for solar manufacturers. In 2022, the U.S. Department of Commerce initiated an investigation into potential tariff evasion involving solar products imported from Southeast Asia, which could impact JA Solar's strategy as they rely on these regions for manufacturing. The ongoing situation has led to a projected increase in logistics costs by as much as 15% by 2024.
Political stability in manufacturing regions
JA Solar's manufacturing facilities are predominantly located in China, where political stability has enabled consistent production levels. However, the Chinese government's strict regulations and control over manufacturing sectors can pose risks. According to the World Bank, China maintained a political stability index of 0.73 in 2023, reflecting a moderate risk level. This stability is crucial, as any significant political unrest could disrupt operations and supply chains significantly.
| Political Factor | Details | Impact on JA Solar |
|---|---|---|
| Government Incentives | Subsidies for solar installations, target of 50 GW for 2023 | Enhances market opportunities |
| Trade Policies | 25% tariffs on Chinese solar imports to the US | Increases costs and reduces competitiveness |
| International Relations | Geopolitical tensions affecting supply chain logistics | Potential cost increases of 15% by 2024 |
| Political Stability | Political stability index of 0.73 in China | Ensures consistency in production |
JA Solar Technology Co., Ltd. - PESTLE Analysis: Economic factors
Fluctuations in global energy prices significantly impact JA Solar Technology Co., Ltd. The company's performance is closely tied to the price of solar modules and energy. In early 2023, global solar energy prices were approximately $0.22 per watt, reflecting a decrease from approximately $0.24 per watt in 2022. Such fluctuations can influence the profitability and demand for solar installations.
Currency exchange rate volatility presents another economic challenge. JA Solar operates in various international markets, exposing it to currency risks. For instance, as of September 2023, the Chinese Yuan (CNY) traded at about 6.9 CNY per USD. Given that a significant portion of JA Solar's revenue is denominated in foreign currencies, fluctuations in exchange rates can affect its revenue margins. For example, in Q2 2023, a 1% depreciation of the Yuan against the dollar could potentially reduce revenue by approximately $50 million.
The availability of financing for solar projects is crucial for JA Solar's operations. As of 2023, global investment in solar energy reached around $250 billion, with project financing increasingly becoming accessible. For instance, the Solar Asset Financing market has seen an average annual growth rate of 12% over the past five years. In the U.S., the Department of Energy announced a funding of $1.5 billion for solar projects in January 2023, illustrating the supportive environment for solar investments.
Economic growth in target markets also plays a critical role in shaping JA Solar's prospects. In 2023, the International Monetary Fund (IMF) projected an economic growth rate of 4.5% for emerging markets, where solar adoption is on the rise. Notably, in India and Southeast Asia, solar energy demand is driven by increasing energy needs and government incentives. As per the latest reports, India's solar capacity is expected to reach 100 GW by 2025, bolstered by economic growth averaging 6% annually.
| Factor | 2022 Data | 2023 Data | Impact on JA Solar |
|---|---|---|---|
| Global Solar Energy Price ($/watt) | $0.24 | $0.22 | Lower prices may affect margins |
| CNY to USD Exchange Rate | 6.4 | 6.9 | Increased currency risk |
| Global Investment in Solar Energy ($ billion) | $220 | $250 | More financing opportunities |
| IMF Projected Growth Rate for Emerging Markets (%) | 4.0% | 4.5% | Higher demand for solar installations |
JA Solar Technology Co., Ltd. - PESTLE Analysis: Social factors
Increasing consumer awareness of renewable energy has significantly impacted the solar energy market. A survey conducted by the International Energy Agency (IEA) in 2022 revealed that approximately 69% of consumers globally are increasingly concerned about climate change and are willing to invest in renewable energy solutions. This shift in consumer behavior has led to an uptick in solar installations, with residential solar power systems growing by 19% year-over-year according to the Solar Energy Industries Association (SEIA).
Growing demand for sustainable energy solutions is reflected in the rising investments in solar technology. In 2023, global solar investment reached approximately $226 billion, with the Asia-Pacific region accounting for more than 40% of the total market share. The demand for solar panels, particularly in China, is robust, driven by government incentives and a commitment to carbon neutrality by 2060.
Urbanization driving energy needs is another critical factor. According to the United Nations, 56% of the world's population lived in urban areas in 2020, projected to reach 68% by 2050. This urban migration increases energy consumption, necessitating sustainable energy sources. JA Solar has strategically positioned itself to meet this growing demand, supplying solar solutions for both urban and rural applications.
Public perception of solar technology remains favorable, with increased acceptance among consumers. A 2023 report from Pew Research indicated that 82% of Americans support the development of solar energy projects in their communities. Furthermore, the levelized cost of electricity (LCOE) for solar energy has decreased by over 90% since 2010, making it more accessible and appealing to consumers.
As of 2022, the average LCOE for utility-scale solar projects was estimated at $32 per MWh, compared to fossil fuels which average around $60 per MWh.
| Factor | Statistics |
|---|---|
| Consumer Awareness Level | 69% of consumers concerned about climate change |
| Growth in Residential Solar Installations | 19% year-over-year increase |
| Global Solar Investment (2023) | $226 billion |
| Urban Population Percentage (2020) | 56%, projected to reach 68% by 2050 |
| Public Support for Solar Projects (2023) | 82% of Americans |
| Average LCOE for Utility-scale Solar (2022) | $32 per MWh |
| Average LCOE for Fossil Fuels | $60 per MWh |
JA Solar's proactive engagement in the public sphere and its commitment to enhancing social value through renewable energy significantly enhance its market position. The growing emphasis on sustainability among consumers not only strengthens the demand for products but also aligns with global energy transition goals.
JA Solar Technology Co., Ltd. - PESTLE Analysis: Technological factors
Advancements in photovoltaic efficiency
JA Solar has made significant progress in increasing the efficiency of its photovoltaic (PV) cells. In 2023, the company announced that its high-efficiency monocrystalline PERC cells achieved a conversion efficiency of up to 26.1%. This is a substantial improvement when compared to the global average efficiency of PV cells, which stands around 20.5% for conventional technologies. The advancements in cell efficiency can enhance energy yield by approximately 10-20% over the lifespan of the panels.
Innovation in energy storage solutions
JA Solar is actively investing in energy storage technology to complement its solar products. The company's strategic partnership with major battery manufacturers has led to the development of integrated solar and storage solutions. As of 2023, JA Solar introduced energy storage systems featuring lithium-ion batteries with a cycle life of over 5,000 cycles and energy density of approximately 200 Wh/kg. Such innovations meet the increasing demand for reliable energy solutions as the global battery storage market is forecasted to exceed $100 billion by 2026, reflecting a compound annual growth rate (CAGR) of 35%.
Development of smart grid technologies
JA Solar is also focusing on the integration of smart grid technologies. The company has begun pilot projects that utilize advanced metering infrastructure (AMI) and demand response systems. The global smart grid market is anticipated to grow from about $26.14 billion in 2022 to approximately $61.95 billion by 2030, at a CAGR of 11.5%. By aligning with these trends, JA Solar positions itself as a leader in facilitating energy efficiency and demand-side management.
Competition in solar technology advancements
The solar technology landscape is highly competitive. In 2023, JA Solar faced competition from other Chinese solar manufacturers such as LONGi Green Energy and Trina Solar, which also reported high-efficiency cells reaching around 25.5%. The market share of JA Solar was estimated at approximately 12.6% in the global module market, but the competition remains intense with LONGi holding 16.2% market share. Continuous innovation and investment in research and development (R&D) are critical as JA Solar's R&D expenses exceeded $700 million in 2022, reflecting the company's commitment to maintaining technological leadership.
| Technological Factor | JA Solar's Achievements | Market Statistics |
|---|---|---|
| Photovoltaic Efficiency | Up to 26.1% conversion efficiency | Global average ~20.5% |
| Energy Storage Solutions | 5,000 cycles, 200 Wh/kg energy density | Market forecast ~>$100 billion by 2026 |
| Smart Grid Technologies | Pilot projects using AMI | Market growth from $26.14 billion to $61.95 billion by 2030 |
| Competition | 12.6% global module market share | LONGi at 16.2% market share |
JA Solar Technology Co., Ltd. - PESTLE Analysis: Legal factors
JA Solar Technology Co., Ltd. operates in a complex legal environment influenced by various regulations that affect its operations globally.
Compliance with international trade regulations
JA Solar is subject to international trade laws that govern exports and imports. The company adheres to regulations set by the World Trade Organization (WTO) which can impact tariffs and trade agreements. For instance, as of 2023, the company has reported compliance with the U.S. import regulations on solar products, particularly the Section 201 tariffs affecting solar panels. These tariffs, which can be as high as 18% on certain imported solar panels, have influenced pricing strategies and supply chain management.
Adherence to environmental laws and standards
In terms of environmental compliance, JA Solar must align with stringent regulations such as the European Union’s Directive on Waste Electrical and Electronic Equipment (WEEE) and RoHS (Restriction of Hazardous Substances). The company's commitment to sustainability is reflected in its goal to achieve a 30% reduction in carbon emissions by 2025. As of 2023, they have also invested approximately $500 million in solar recycling initiatives to comply with these standards.
Intellectual property rights protection
Intellectual property rights are crucial for JA Solar, especially in maintaining competitive advantages in technology. The company has secured over 3,000 patents globally as of the latest report in 2023. This robust portfolio includes innovations in solar cell technology and manufacturing processes. Legal disputes regarding patent infringement have been a concern; however, JA Solar has successfully defended its patents in several key markets, reinforcing its position within the solar industry.
Tariffs and import/export regulations
Tariffs significantly impact JA Solar’s operational costs and pricing strategies. In 2022, it was reported that the U.S. solar industry faced challenges due to the $300 million in tariffs applied to solar panel imports. Moreover, JA Solar has navigated complex import/export regulations in China, where the export quota for solar products was raised to $100 billion for the fiscal year 2023. Table 1 below summarizes the tariff rates affecting JA Solar across different regions:
| Region | Tariff Rate (%) | Impact on Costs (Estimated $ million) |
|---|---|---|
| United States | 18 | 300 |
| European Union | 0-5 | 50 |
| China | 0 | 0 |
| India | 25 | 200 |
These factors collectively influence JA Solar's strategic planning and operational effectiveness. Compliance with international trade regulations, environmental laws, and strong intellectual property protections are essential in navigating the legal landscape in which the company operates.
JA Solar Technology Co., Ltd. - PESTLE Analysis: Environmental factors
JA Solar Technology Co., Ltd. operates in an industry where environmental factors play a significant role in shaping business practices and consumer preferences. The following analysis delves into key environmental aspects surrounding the company’s operations.
Impact of Solar Panel Production on Ecosystems
The production of solar panels involves significant raw materials, which can impact ecosystems. For instance, the production of one gigawatt (GW) of solar photovoltaic (PV) systems requires approximately 3,500 tons of silicon, resulting in potential habitat disruption if not managed properly. According to a 2022 report, JA Solar is estimated to produce around 20 GW of solar panels annually, which translates to a potential requirement of approximately 70,000 tons of silicon.
Reduction of Carbon Footprint through Solar Adoption
Solar energy adoption significantly reduces carbon emissions. A study from the National Renewable Energy Laboratory (NREL) indicates that for every megawatt-hour (MWh) generated by solar energy, around 0.8 metric tons of CO2 emissions are avoided. With JA Solar's annual production capacity of 20 GW, the company enables the reduction of approximately 16 million tons of CO2 emissions each year.
Waste Management for Solar Components
Effective waste management of solar components is critical. The International Renewable Energy Agency (IRENA) estimates that by 2050, the cumulative waste from solar panels could reach about 78 million tons globally. JA Solar is implementing recycling initiatives, with an estimated 90% of its solar panel materials being recyclable. They aim to establish a robust end-of-life management program by 2025 to manage and recycle approximately 2 million tons of solar panel waste.
Promotion of Sustainable Manufacturing Practices
JA Solar is committed to sustainable manufacturing, aiming to lower its environmental impact. The company has invested over $100 million in clean technology innovations. In 2022, their energy consumption per watt of solar capacity produced was reduced to 2.5 kWh, a decrease of 15% from the previous year. They have set a target to further reduce this figure to 2.0 kWh by 2025.
| Environmental Factor | Data/Impact |
|---|---|
| Annual Production Capacity | 20 GW |
| Silicon Requirement for Production | 70,000 tons |
| CO2 Emissions Reduced per Year | 16 million tons |
| Percentage of Recyclable Materials | 90% |
| Projected Solar Panel Waste by 2050 | 78 million tons |
| Investment in Clean Technology | $100 million |
| Energy Consumption per Watt (2022) | 2.5 kWh |
| Targeted Energy Consumption per Watt (2025) | 2.0 kWh |
JA Solar Technology Co., Ltd. operates at the intersection of various dynamic factors highlighted in the PESTLE analysis, revealing both challenges and opportunities within the renewable energy sector. From navigating government incentives and trade policies to addressing rising consumer demand and technological innovations, the company's strategic positioning underscores its potential for sustainable growth in an increasingly eco-conscious world.
Disclaimer
All information, articles, and product details provided on this website are for general informational and educational purposes only. We do not claim any ownership over, nor do we intend to infringe upon, any trademarks, copyrights, logos, brand names, or other intellectual property mentioned or depicted on this site. Such intellectual property remains the property of its respective owners, and any references here are made solely for identification or informational purposes, without implying any affiliation, endorsement, or partnership.
We make no representations or warranties, express or implied, regarding the accuracy, completeness, or suitability of any content or products presented. Nothing on this website should be construed as legal, tax, investment, financial, medical, or other professional advice. In addition, no part of this site—including articles or product references—constitutes a solicitation, recommendation, endorsement, advertisement, or offer to buy or sell any securities, franchises, or other financial instruments, particularly in jurisdictions where such activity would be unlawful.
All content is of a general nature and may not address the specific circumstances of any individual or entity. It is not a substitute for professional advice or services. Any actions you take based on the information provided here are strictly at your own risk. You accept full responsibility for any decisions or outcomes arising from your use of this website and agree to release us from any liability in connection with your use of, or reliance upon, the content or products found herein.