
|
Shenzhen Grandland Group Co., Ltd. (002482.SZ) DCF Valuation |
Fully Editable: Tailor To Your Needs In Excel Or Sheets
Professional Design: Trusted, Industry-Standard Templates
Investor-Approved Valuation Models
MAC/PC Compatible, Fully Unlocked
No Expertise Is Needed; Easy To Follow
Shenzhen Grandland Group Co., Ltd. (002482.SZ) Bundle
Streamline Shenzhen Grandland Group Co., Ltd. (002482SZ) valuation with our customizable DCF Calculator! Utilizing real Shenzhen Grandland Group Co., Ltd. (002482SZ) financials and adjustable forecast inputs, you can explore different scenarios and determine Shenzhen Grandland Group Co., Ltd. (002482SZ) fair value in just minutes.
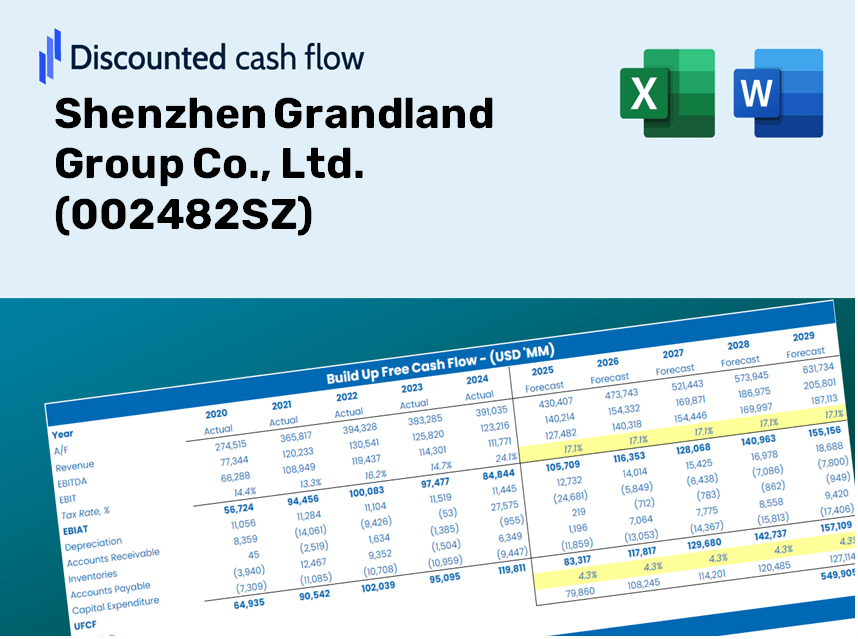
Discounted Cash Flow (DCF) - (USD MM)
| Year | AY1 2020 |
AY2 2021 |
AY3 2022 |
AY4 2023 |
AY5 2024 |
FY1 2025 |
FY2 2026 |
FY3 2027 |
FY4 2028 |
FY5 2029 |
|---|---|---|---|---|---|---|---|---|---|---|
| Revenue | 12,246.5 | 8,036.4 | 3,563.7 | 1,002.5 | 757.7 | 404.8 | 216.2 | 115.5 | 61.7 | 33.0 |
| Revenue Growth, % | 0 | -34.38 | -55.66 | -71.87 | -24.42 | -46.58 | -46.58 | -46.58 | -46.58 | -46.58 |
| EBITDA | -225.0 | -5,606.6 | -5,083.6 | 3,437.1 | -109.4 | -69.6 | -37.2 | -19.9 | -10.6 | -5.7 |
| EBITDA, % | -1.84 | -69.77 | -142.65 | 342.85 | -14.44 | -17.21 | -17.21 | -17.21 | -17.21 | -17.21 |
| Depreciation | 63.5 | 111.5 | 127.3 | 165.7 | 63.9 | 24.7 | 13.2 | 7.0 | 3.8 | 2.0 |
| Depreciation, % | 0.51867 | 1.39 | 3.57 | 16.53 | 8.44 | 6.09 | 6.09 | 6.09 | 6.09 | 6.09 |
| EBIT | -288.5 | -5,718.2 | -5,210.9 | 3,271.3 | -173.3 | -78.0 | -41.7 | -22.3 | -11.9 | -6.4 |
| EBIT, % | -2.36 | -71.15 | -146.22 | 326.32 | -22.87 | -19.28 | -19.28 | -19.28 | -19.28 | -19.28 |
| Total Cash | 2,294.9 | 1,058.7 | 708.4 | 183.7 | 538.0 | 114.2 | 61.0 | 32.6 | 17.4 | 9.3 |
| Total Cash, percent | .0 | .0 | .0 | .0 | .0 | .0 | .0 | .0 | .0 | .0 |
| Account Receivables | 16,059.7 | 10,740.2 | 6,453.3 | 228.0 | 538.9 | 318.8 | 170.3 | 91.0 | 48.6 | 26.0 |
| Account Receivables, % | 131.14 | 133.65 | 181.08 | 22.74 | 71.12 | 78.77 | 78.77 | 78.77 | 78.77 | 78.77 |
| Inventories | 864.3 | 800.5 | 573.1 | 41.5 | 30.0 | 33.4 | 17.8 | 9.5 | 5.1 | 2.7 |
| Inventories, % | 7.06 | 9.96 | 16.08 | 4.14 | 3.96 | 8.24 | 8.24 | 8.24 | 8.24 | 8.24 |
| Accounts Payable | 9,681.5 | 8,702.6 | 5,676.6 | 260.3 | 540.6 | 304.7 | 162.8 | 86.9 | 46.4 | 24.8 |
| Accounts Payable, % | 79.06 | 108.29 | 159.29 | 25.96 | 71.35 | 75.27 | 75.27 | 75.27 | 75.27 | 75.27 |
| Capital Expenditure | -194.4 | -87.6 | -.9 | -.6 | -52.6 | -7.9 | -4.2 | -2.2 | -1.2 | -.6 |
| Capital Expenditure, % | -1.59 | -1.09 | -0.02621709 | -0.05560118 | -6.94 | -1.94 | -1.94 | -1.94 | -1.94 | -1.94 |
| Tax Rate, % | 1.63 | 1.63 | 1.63 | 1.63 | 1.63 | 1.63 | 1.63 | 1.63 | 1.63 | 1.63 |
| EBITAT | -265.5 | -5,433.4 | -5,119.8 | 2,551.8 | -170.5 | -72.0 | -38.5 | -20.6 | -11.0 | -5.9 |
| Depreciation | ||||||||||
| Changes in Account Receivables | ||||||||||
| Changes in Inventories | ||||||||||
| Changes in Accounts Payable | ||||||||||
| Capital Expenditure | ||||||||||
| UFCF | -7,638.9 | -1,005.0 | -3,505.2 | 4,057.7 | -178.2 | -74.5 | -7.4 | -3.9 | -2.1 | -1.1 |
| WACC, % | 6.75 | 6.76 | 6.78 | 6.67 | 6.78 | 6.75 | 6.75 | 6.75 | 6.75 | 6.75 |
| PV UFCF | ||||||||||
| SUM PV UFCF | -81.9 | |||||||||
| Long Term Growth Rate, % | 2.00 | |||||||||
| Free cash flow (T + 1) | -1 | |||||||||
| Terminal Value | -24 | |||||||||
| Present Terminal Value | -17 | |||||||||
| Enterprise Value | -99 | |||||||||
| Net Debt | 748 | |||||||||
| Equity Value | -848 | |||||||||
| Diluted Shares Outstanding, MM | 4,013 | |||||||||
| Equity Value Per Share | -0.21 |
Benefits of Choosing Shenzhen Grandland Group Co., Ltd. (002482SZ)
- Comprehensive Financial Model: Utilize Shenzhen Grandland's actual data for accurate DCF valuation.
- Dynamic Forecasting Control: Modify revenue growth, profit margins, WACC, and other essential parameters.
- Real-Time Calculations: Instant updates provide immediate feedback on your adjustments.
- Professional-Grade Template: An expertly crafted Excel file prepared for high-level valuation analysis.
- Flexible and Reusable: Designed for adaptability, facilitating repeated use for in-depth forecasting.
Key Features
- Comprehensive DCF Calculator: Offers robust unlevered and levered DCF valuation models tailored for Shenzhen Grandland Group Co., Ltd. (002482SZ).
- WACC Calculator: Pre-structured Weighted Average Cost of Capital sheet with adjustable inputs for precise analysis.
- Customizable Forecast Assumptions: Easily change growth rates, capital expenditures, and discount rates to fit your analysis.
- Integrated Financial Ratios: Evaluate profitability, leverage, and efficiency ratios specific to Shenzhen Grandland Group Co., Ltd. (002482SZ).
- Interactive Dashboard and Visuals: Graphical outputs present essential valuation metrics for straightforward interpretation.
How It Operates
- Download: Obtain the pre-configured Excel file containing Shenzhen Grandland Group Co., Ltd.'s (002482SZ) financial data.
- Customize: Modify projections, including revenue growth, EBITDA %, and WACC as needed.
- Auto-Update: The intrinsic value and NPV calculations refresh automatically in real-time.
- Explore Scenarios: Generate various forecasts and instantly compare their results.
- Make Informed Decisions: Leverage the valuation insights to inform your investment strategy.
Why Opt for This Calculator?
- Designed for Experts: A sophisticated instrument favored by analysts, CFOs, and consultants.
- Accurate Data: Shenzhen Grandland Group Co., Ltd. ([002482SZ])'s historical and projected financials are pre-loaded for reliability.
- Forecast Simulations: Effortlessly model various scenarios and assumptions.
- Transparent Results: Instantly computes intrinsic value, NPV, and essential metrics.
- User-Friendly: Comprehensive step-by-step guidance makes navigation simple.
Who Should Use This Product?
- Professional Investors: Develop comprehensive and accurate valuation models for evaluating investments in Shenzhen Grandland Group Co., Ltd. (002482SZ).
- Corporate Finance Teams: Assess valuation scenarios to inform strategic decisions within the organization.
- Consultants and Advisors: Equip clients with precise valuation insights regarding Shenzhen Grandland Group Co., Ltd. (002482SZ).
- Students and Educators: Utilize authentic market data to practice and teach financial modeling principles.
- Industry Enthusiasts: Gain insights into how companies like Shenzhen Grandland Group Co., Ltd. (002482SZ) are valued within the market.
Overview of Template Features
- Preloaded Grandland Data: Historical and forecasted financial data, encompassing revenue, EBIT, and capital expenditures.
- DCF and WACC Models: Advanced spreadsheets for calculating intrinsic value and Weighted Average Cost of Capital.
- Editable Inputs: Yellow-highlighted cells that allow for modifications to revenue growth, tax rates, and discount rates.
- Financial Statements: Detailed annual and quarterly financials for thorough analysis.
- Key Ratios: Metrics for profitability, leverage, and efficiency to assess performance.
- Dashboard and Charts: Visual representations of valuation results and underlying assumptions.
Disclaimer
All information, articles, and product details provided on this website are for general informational and educational purposes only. We do not claim any ownership over, nor do we intend to infringe upon, any trademarks, copyrights, logos, brand names, or other intellectual property mentioned or depicted on this site. Such intellectual property remains the property of its respective owners, and any references here are made solely for identification or informational purposes, without implying any affiliation, endorsement, or partnership.
We make no representations or warranties, express or implied, regarding the accuracy, completeness, or suitability of any content or products presented. Nothing on this website should be construed as legal, tax, investment, financial, medical, or other professional advice. In addition, no part of this site—including articles or product references—constitutes a solicitation, recommendation, endorsement, advertisement, or offer to buy or sell any securities, franchises, or other financial instruments, particularly in jurisdictions where such activity would be unlawful.
All content is of a general nature and may not address the specific circumstances of any individual or entity. It is not a substitute for professional advice or services. Any actions you take based on the information provided here are strictly at your own risk. You accept full responsibility for any decisions or outcomes arising from your use of this website and agree to release us from any liability in connection with your use of, or reliance upon, the content or products found herein.