
|
JC Finance&Tax Interconnect Holdings Ltd. (002530.SZ) DCF Valuation |
Fully Editable: Tailor To Your Needs In Excel Or Sheets
Professional Design: Trusted, Industry-Standard Templates
Investor-Approved Valuation Models
MAC/PC Compatible, Fully Unlocked
No Expertise Is Needed; Easy To Follow
JC Finance&Tax Interconnect Holdings Ltd. (002530.SZ) Bundle
Evaluate the financial outlook of JC Finance&Tax Interconnect Holdings Ltd. (002530SZ) like an expert! This (002530SZ) DCF Calculator provides pre-filled financial data and allows you to easily modify revenue growth, WACC, margins, and other essential assumptions to align with your projections.
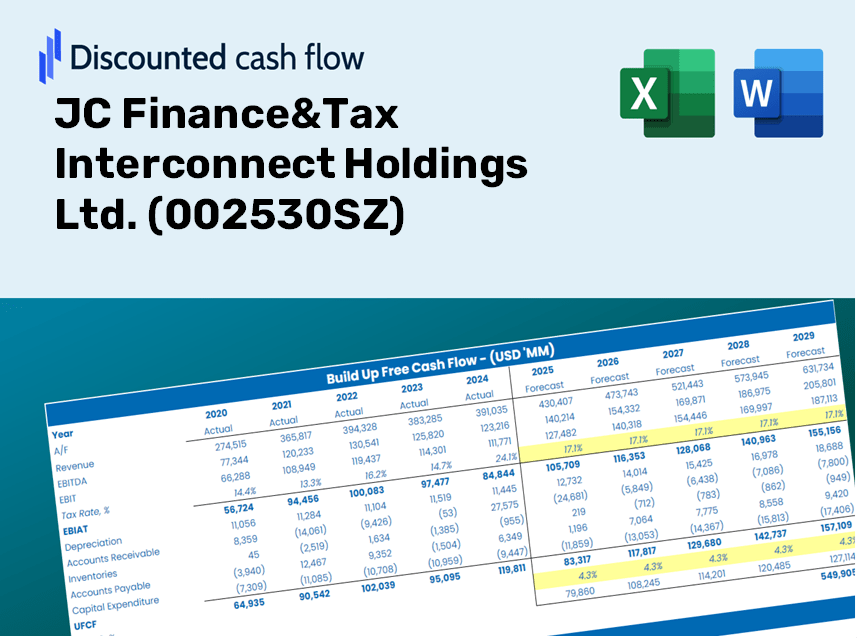
Discounted Cash Flow (DCF) - (USD MM)
| Year | AY1 2020 |
AY2 2021 |
AY3 2022 |
AY4 2023 |
AY5 2024 |
FY1 2025 |
FY2 2026 |
FY3 2027 |
FY4 2028 |
FY5 2029 |
|---|---|---|---|---|---|---|---|---|---|---|
| Revenue | 1,011.5 | 1,201.9 | 1,219.7 | 1,203.9 | 1,265.7 | 1,342.1 | 1,423.2 | 1,509.1 | 1,600.2 | 1,696.8 |
| Revenue Growth, % | 0 | 18.83 | 1.48 | -1.3 | 5.14 | 6.04 | 6.04 | 6.04 | 6.04 | 6.04 |
| EBITDA | -126.6 | -86.9 | -25.8 | 35.2 | 89.6 | -31.8 | -33.8 | -35.8 | -38.0 | -40.3 |
| EBITDA, % | -12.52 | -7.23 | -2.12 | 2.92 | 7.08 | -2.37 | -2.37 | -2.37 | -2.37 | -2.37 |
| Depreciation | 142.3 | 156.6 | 134.5 | 78.7 | 81.5 | 137.2 | 145.5 | 154.3 | 163.6 | 173.4 |
| Depreciation, % | 14.07 | 13.03 | 11.03 | 6.54 | 6.44 | 10.22 | 10.22 | 10.22 | 10.22 | 10.22 |
| EBIT | -268.9 | -243.5 | -160.3 | -43.6 | 8.1 | -169.0 | -179.2 | -190.1 | -201.5 | -213.7 |
| EBIT, % | -26.59 | -20.26 | -13.15 | -3.62 | 0.63961 | -12.59 | -12.59 | -12.59 | -12.59 | -12.59 |
| Total Cash | 784.0 | 629.9 | 554.7 | 485.5 | 330.2 | 649.1 | 688.3 | 729.8 | 773.9 | 820.6 |
| Total Cash, percent | .0 | .0 | .0 | .0 | .0 | .0 | .0 | .0 | .0 | .0 |
| Account Receivables | 632.9 | 258.9 | 278.8 | 331.6 | 358.1 | 437.0 | 463.4 | 491.4 | 521.1 | 552.5 |
| Account Receivables, % | 62.57 | 21.54 | 22.86 | 27.55 | 28.29 | 32.56 | 32.56 | 32.56 | 32.56 | 32.56 |
| Inventories | 297.2 | 355.2 | 396.6 | 422.4 | 334.3 | 410.6 | 435.3 | 461.6 | 489.5 | 519.0 |
| Inventories, % | 29.38 | 29.55 | 32.52 | 35.09 | 26.41 | 30.59 | 30.59 | 30.59 | 30.59 | 30.59 |
| Accounts Payable | 264.7 | 277.6 | 247.7 | 250.7 | 147.9 | 274.0 | 290.6 | 308.1 | 326.7 | 346.4 |
| Accounts Payable, % | 26.17 | 23.09 | 20.31 | 20.82 | 11.68 | 20.42 | 20.42 | 20.42 | 20.42 | 20.42 |
| Capital Expenditure | -180.5 | -176.0 | -91.7 | -82.7 | -81.1 | -143.0 | -151.7 | -160.8 | -170.5 | -180.8 |
| Capital Expenditure, % | -17.84 | -14.65 | -7.52 | -6.87 | -6.41 | -10.66 | -10.66 | -10.66 | -10.66 | -10.66 |
| Tax Rate, % | 138.14 | 138.14 | 138.14 | 138.14 | 138.14 | 138.14 | 138.14 | 138.14 | 138.14 | 138.14 |
| EBITAT | -265.4 | -254.8 | -202.1 | -86.2 | -3.1 | -134.8 | -142.9 | -151.5 | -160.7 | -170.4 |
| Depreciation | ||||||||||
| Changes in Account Receivables | ||||||||||
| Changes in Inventories | ||||||||||
| Changes in Accounts Payable | ||||||||||
| Capital Expenditure | ||||||||||
| UFCF | -968.9 | 54.7 | -250.5 | -165.7 | -43.9 | -169.7 | -183.7 | -194.8 | -206.6 | -219.1 |
| WACC, % | 6.13 | 6.13 | 6.13 | 6.13 | 6.02 | 6.11 | 6.11 | 6.11 | 6.11 | 6.11 |
| PV UFCF | ||||||||||
| SUM PV UFCF | -811.9 | |||||||||
| Long Term Growth Rate, % | 2.00 | |||||||||
| Free cash flow (T + 1) | -223 | |||||||||
| Terminal Value | -5,436 | |||||||||
| Present Terminal Value | -4,041 | |||||||||
| Enterprise Value | -4,853 | |||||||||
| Net Debt | -177 | |||||||||
| Equity Value | -4,676 | |||||||||
| Diluted Shares Outstanding, MM | 916 | |||||||||
| Equity Value Per Share | -5.10 |
What You Will Receive
- Authentic JC Finance&Tax Data: Features historical and projected financial details for precise evaluation.
- Customizable Parameters: Adjust WACC, tax rates, revenue growth, and capital expenditures as needed.
- Dynamic Calculations: Intrinsic value and NPV are calculated on the fly.
- Scenario Testing: Analyze various scenarios to assess the future performance of JC Finance&Tax Interconnect Holdings Ltd.
- User-Friendly and Professional Design: Designed for experts while remaining approachable for newcomers.
Key Features
- Pre-Loaded Data: Historical financial statements and pre-filled forecasts for JC Finance&Tax Interconnect Holdings Ltd. (002530SZ).
- Fully Customizable Inputs: Modify WACC, tax rates, revenue growth, and EBITDA margins to suit your analysis.
- Instant Feedback: Observe the recalibration of JC Finance&Tax's intrinsic value in real time.
- Clear Visual Outputs: Interactive dashboard charts showcase valuation results and essential metrics.
- Designed for Precision: A robust tool tailored for analysts, investors, and finance professionals.
How It Works
- Download: Obtain the pre-prepared Excel file featuring JC Finance&Tax Interconnect Holdings Ltd.’s (002530SZ) financial data.
- Customize: Modify forecasts such as revenue growth, EBITDA %, and WACC to suit your analysis.
- Update Automatically: Watch as intrinsic value and NPV calculations refresh in real-time.
- Test Scenarios: Generate various projections and compare results effortlessly.
- Make Decisions: Leverage the valuation outcomes to inform your investment strategy.
Why Select This Calculator for JC Finance & Tax Interconnect Holdings Ltd. (002530SZ)?
- Reliable Data: Access real JC Finance & Tax financial figures for trustworthy valuation outcomes.
- Flexible: Tailor essential parameters like growth rates, WACC, and tax rates to align with your forecasts.
- Efficient: Built-in calculations streamline your workflow, eliminating the need to start anew.
- Professional Tool: Crafted for the needs of investors, analysts, and consultants.
- User-Friendly: An intuitive design and clear instructions ensure ease of use for all skill levels.
Who Can Benefit from JC Finance&Tax Interconnect Holdings Ltd. (002530SZ)?
- Investment Professionals: Develop comprehensive and trustworthy valuation models for asset management.
- Corporate Finance Departments: Evaluate valuation scenarios to inform strategic decisions within the company.
- Financial Consultants and Advisors: Equip clients with precise valuation insights regarding JC Finance&Tax Interconnect Holdings Ltd. (002530SZ).
- Students and Educators: Leverage real-time data to enhance the practice and teaching of financial modeling.
- Finance Enthusiasts: Gain insights into the market valuation of companies like JC Finance&Tax Interconnect Holdings Ltd. (002530SZ).
Contents of the Template
- Preloaded JC Finance&Tax Data: Historical and forecasted financial metrics, including revenue, EBIT, and capital expenditures.
- DCF and WACC Models: High-quality spreadsheets for assessing intrinsic value and calculating the Weighted Average Cost of Capital.
- Customizable Inputs: Cells highlighted in yellow for modifying revenue growth, tax rates, and discount rates.
- Financial Statements: Detailed annual and quarterly financial reports for in-depth analysis.
- Key Ratios: Ratios for profitability, leverage, and efficiency to assess overall performance.
- Dashboard and Graphs: Visual representations of valuation results and underlying assumptions.
Disclaimer
All information, articles, and product details provided on this website are for general informational and educational purposes only. We do not claim any ownership over, nor do we intend to infringe upon, any trademarks, copyrights, logos, brand names, or other intellectual property mentioned or depicted on this site. Such intellectual property remains the property of its respective owners, and any references here are made solely for identification or informational purposes, without implying any affiliation, endorsement, or partnership.
We make no representations or warranties, express or implied, regarding the accuracy, completeness, or suitability of any content or products presented. Nothing on this website should be construed as legal, tax, investment, financial, medical, or other professional advice. In addition, no part of this site—including articles or product references—constitutes a solicitation, recommendation, endorsement, advertisement, or offer to buy or sell any securities, franchises, or other financial instruments, particularly in jurisdictions where such activity would be unlawful.
All content is of a general nature and may not address the specific circumstances of any individual or entity. It is not a substitute for professional advice or services. Any actions you take based on the information provided here are strictly at your own risk. You accept full responsibility for any decisions or outcomes arising from your use of this website and agree to release us from any liability in connection with your use of, or reliance upon, the content or products found herein.