
|
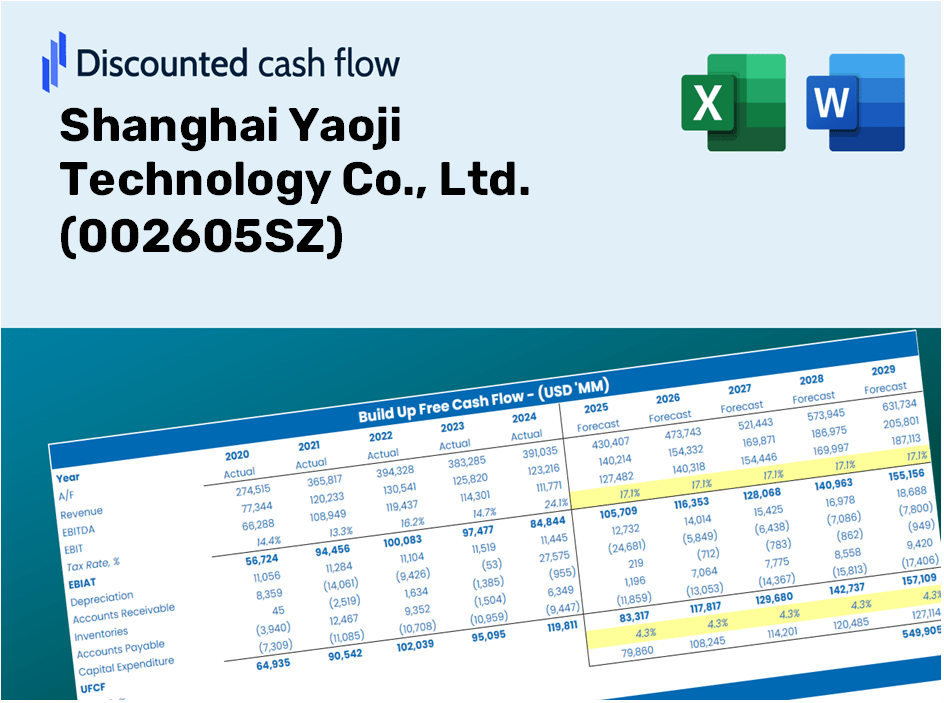
Shanghai Yaoji Technology Co., Ltd. (002605.SZ) DCF Valuation |
Fully Editable: Tailor To Your Needs In Excel Or Sheets
Professional Design: Trusted, Industry-Standard Templates
Investor-Approved Valuation Models
MAC/PC Compatible, Fully Unlocked
No Expertise Is Needed; Easy To Follow
Shanghai Yaoji Technology Co., Ltd. (002605.SZ) Bundle
Explore the financial future of Shanghai Yaoji Technology Co., Ltd. (002605SZ) with our user-friendly DCF Calculator! Enter your projections for growth, margins, and expenses to determine the intrinsic value of Shanghai Yaoji Technology Co., Ltd. (002605SZ) and enhance your investment strategy.
Discounted Cash Flow (DCF) - (USD MM)
| Year | AY1 2020 |
AY2 2021 |
AY3 2022 |
AY4 2023 |
AY5 2024 |
FY1 2025 |
FY2 2026 |
FY3 2027 |
FY4 2028 |
FY5 2029 |
|---|---|---|---|---|---|---|---|---|---|---|
| Revenue | 2,561.9 | 3,807.2 | 3,914.8 | 4,306.9 | 3,271.4 | 3,220.5 | 3,170.4 | 3,121.1 | 3,072.5 | 3,024.7 |
| Revenue Growth, % | 0 | 48.61 | 2.83 | 10.01 | -24.04 | -1.56 | -1.56 | -1.56 | -1.56 | -1.56 |
| EBITDA | 713.7 | 635.4 | 596.9 | 812.3 | 728.1 | 650.0 | 639.9 | 629.9 | 620.1 | 610.5 |
| EBITDA, % | 27.86 | 16.69 | 15.25 | 18.86 | 22.26 | 20.18 | 20.18 | 20.18 | 20.18 | 20.18 |
| Depreciation | 50.2 | 46.2 | 50.4 | 53.4 | 50.1 | 46.6 | 45.9 | 45.1 | 44.4 | 43.7 |
| Depreciation, % | 1.96 | 1.21 | 1.29 | 1.24 | 1.53 | 1.45 | 1.45 | 1.45 | 1.45 | 1.45 |
| EBIT | 663.6 | 589.2 | 546.5 | 758.9 | 678.0 | 603.4 | 594.0 | 584.8 | 575.7 | 566.7 |
| EBIT, % | 25.9 | 15.47 | 13.96 | 17.62 | 20.72 | 18.74 | 18.74 | 18.74 | 18.74 | 18.74 |
| Total Cash | 659.1 | 582.2 | 757.1 | 720.8 | 1,080.7 | 709.3 | 698.3 | 687.4 | 676.7 | 666.2 |
| Total Cash, percent | .0 | .0 | .0 | .0 | .0 | .0 | .0 | .0 | .0 | .0 |
| Account Receivables | 279.7 | 338.9 | 449.0 | 732.6 | 517.2 | 412.9 | 406.5 | 400.2 | 393.9 | 387.8 |
| Account Receivables, % | 10.92 | 8.9 | 11.47 | 17.01 | 15.81 | 12.82 | 12.82 | 12.82 | 12.82 | 12.82 |
| Inventories | 271.2 | 317.5 | 381.4 | 417.4 | 422.9 | 330.3 | 325.2 | 320.1 | 315.2 | 310.2 |
| Inventories, % | 10.58 | 8.34 | 9.74 | 9.69 | 12.93 | 10.26 | 10.26 | 10.26 | 10.26 | 10.26 |
| Accounts Payable | 407.2 | 365.7 | 632.4 | 550.8 | 436.9 | 436.7 | 429.9 | 423.2 | 416.6 | 410.1 |
| Accounts Payable, % | 15.9 | 9.61 | 16.15 | 12.79 | 13.35 | 13.56 | 13.56 | 13.56 | 13.56 | 13.56 |
| Capital Expenditure | -86.1 | -105.4 | -67.3 | -246.3 | -182.6 | -123.3 | -121.4 | -119.5 | -117.7 | -115.8 |
| Capital Expenditure, % | -3.36 | -2.77 | -1.72 | -5.72 | -5.58 | -3.83 | -3.83 | -3.83 | -3.83 | -3.83 |
| Tax Rate, % | 20.8 | 20.8 | 20.8 | 20.8 | 20.8 | 20.8 | 20.8 | 20.8 | 20.8 | 20.8 |
| EBITAT | 555.0 | 537.3 | 439.1 | 599.5 | 537.0 | 498.9 | 491.1 | 483.5 | 475.9 | 468.5 |
| Depreciation | ||||||||||
| Changes in Account Receivables | ||||||||||
| Changes in Inventories | ||||||||||
| Changes in Accounts Payable | ||||||||||
| Capital Expenditure | ||||||||||
| UFCF | 375.5 | 331.0 | 514.9 | 5.4 | 500.5 | 618.8 | 420.3 | 413.8 | 407.3 | 401.0 |
| WACC, % | 6.33 | 6.36 | 6.31 | 6.31 | 6.31 | 6.32 | 6.32 | 6.32 | 6.32 | 6.32 |
| PV UFCF | ||||||||||
| SUM PV UFCF | 1,912.0 | |||||||||
| Long Term Growth Rate, % | 3.50 | |||||||||
| Free cash flow (T + 1) | 415 | |||||||||
| Terminal Value | 14,705 | |||||||||
| Present Terminal Value | 10,822 | |||||||||
| Enterprise Value | 12,734 | |||||||||
| Net Debt | -395 | |||||||||
| Equity Value | 13,129 | |||||||||
| Diluted Shares Outstanding, MM | 426 | |||||||||
| Equity Value Per Share | 30.83 |
What You Will Receive
- Genuine 002605SZ Financials: Offers historical and projected data for precise valuation.
- Customizable Inputs: Adjust WACC, tax rates, revenue growth, and capital expenditures as needed.
- Automatic Calculations: Intrinsic value and NPV are computed in real-time.
- Scenario Analysis: Explore various scenarios to assess Shanghai Yaoji Technology's future performance.
- User-Friendly Design: Designed for professionals while remaining approachable for newcomers.
Key Features
- Customizable Forecast Variables: Adjust essential metrics such as revenue growth, EBITDA percentage, and capital expenditures.
- Instant DCF Valuation: Quickly calculates intrinsic value, NPV, and other essential outputs.
- High-Precision Accuracy: Leverages Shanghai Yaoji Technology Co., Ltd.’s (002605SZ) actual financial data for reliable valuation results.
- User-Friendly Scenario Analysis: Effortlessly evaluate various assumptions and analyze different outcomes.
- Efficiency Booster: Remove the necessity of constructing intricate valuation models from the ground up.
How It Functions
- Download: Obtain the pre-made Excel file containing Shanghai Yaoji Technology Co., Ltd.'s (002605SZ) financial data.
- Customize: Modify forecasts such as revenue growth, EBITDA percentage, and WACC to fit your analysis.
- Real-Time Updates: Intrinsic value and NPV calculations refresh automatically as you make changes.
- Scenario Testing: Develop various projections and instantly assess their outcomes.
- Informed Decisions: Leverage the valuation results to shape your investment strategy for Shanghai Yaoji Technology Co., Ltd. (002605SZ).
Why Opt for This Calculator?
- Precise Metrics: Accurate financial data from Shanghai Yaoji Technology Co., Ltd. ensure trustworthy valuation outcomes.
- Flexible Settings: Tailor essential parameters like growth rates, WACC, and tax rates to align with your forecasts.
- Efficient: Existing calculations save you the hassle of starting fresh.
- Expert-Level Tool: Crafted for investors, analysts, and consultants in the field.
- Easy to Use: A user-friendly design with straightforward guidance caters to all skill levels.
Who Should Utilize This Product?
- Investors: Gain a precise assessment of Shanghai Yaoji Technology’s fair value before making investment choices.
- CFOs: Utilize a top-tier DCF model for comprehensive financial reporting and analysis.
- Consultants: Effortlessly customize the template for client valuation reports.
- Entrepreneurs: Acquire insights into the financial modeling practices of leading corporations.
- Educators: Employ it as a resource to illustrate valuation techniques in the classroom.
Overview of the Template Features
- Comprehensive DCF Model: An editable template featuring intricate valuation calculations.
- Real-World Data: Historical and projected financials of Shanghai Yaoji Technology Co., Ltd. (002605SZ) preloaded for in-depth analysis.
- Customizable Parameters: Modify WACC, growth rates, and tax assumptions to explore various scenarios.
- Financial Statements: Complete annual and quarterly detailed breakdowns for enhanced insights.
- Key Ratios: Integrated analysis tools for assessing profitability, efficiency, and leverage.
- Dashboard with Visual Outputs: Charts and tables that present clear and actionable results.
Disclaimer
All information, articles, and product details provided on this website are for general informational and educational purposes only. We do not claim any ownership over, nor do we intend to infringe upon, any trademarks, copyrights, logos, brand names, or other intellectual property mentioned or depicted on this site. Such intellectual property remains the property of its respective owners, and any references here are made solely for identification or informational purposes, without implying any affiliation, endorsement, or partnership.
We make no representations or warranties, express or implied, regarding the accuracy, completeness, or suitability of any content or products presented. Nothing on this website should be construed as legal, tax, investment, financial, medical, or other professional advice. In addition, no part of this site—including articles or product references—constitutes a solicitation, recommendation, endorsement, advertisement, or offer to buy or sell any securities, franchises, or other financial instruments, particularly in jurisdictions where such activity would be unlawful.
All content is of a general nature and may not address the specific circumstances of any individual or entity. It is not a substitute for professional advice or services. Any actions you take based on the information provided here are strictly at your own risk. You accept full responsibility for any decisions or outcomes arising from your use of this website and agree to release us from any liability in connection with your use of, or reliance upon, the content or products found herein.