
|
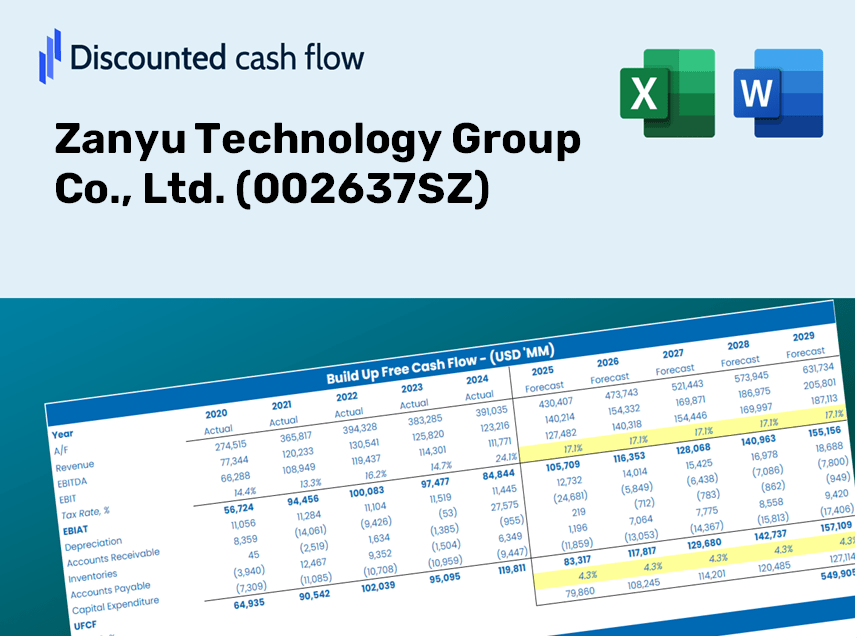
Zanyu Technology Group Co., Ltd. (002637.SZ) DCF Valuation |
Fully Editable: Tailor To Your Needs In Excel Or Sheets
Professional Design: Trusted, Industry-Standard Templates
Investor-Approved Valuation Models
MAC/PC Compatible, Fully Unlocked
No Expertise Is Needed; Easy To Follow
Zanyu Technology Group Co., Ltd. (002637.SZ) Bundle
Whether you're an investor or analyst, this (002637SZ) DCF Calculator is your go-to resource for accurate valuation. Loaded with real data from Zanyu Technology Group Co., Ltd., you can adjust forecasts and observe the effects in real-time.
Discounted Cash Flow (DCF) - (USD MM)
| Year | AY1 2020 |
AY2 2021 |
AY3 2022 |
AY4 2023 |
AY5 2024 |
FY1 2025 |
FY2 2026 |
FY3 2027 |
FY4 2028 |
FY5 2029 |
|---|---|---|---|---|---|---|---|---|---|---|
| Revenue | 7,803.8 | 11,201.2 | 11,235.3 | 9,611.7 | 10,791.5 | 11,915.6 | 13,156.7 | 14,527.1 | 16,040.3 | 17,711.0 |
| Revenue Growth, % | 0 | 43.54 | 0.30394 | -14.45 | 12.27 | 10.42 | 10.42 | 10.42 | 10.42 | 10.42 |
| EBITDA | 749.5 | 1,309.6 | 305.2 | 496.6 | 579.8 | 823.4 | 909.2 | 1,003.9 | 1,108.5 | 1,223.9 |
| EBITDA, % | 9.6 | 11.69 | 2.72 | 5.17 | 5.37 | 6.91 | 6.91 | 6.91 | 6.91 | 6.91 |
| Depreciation | 175.8 | 205.1 | 253.3 | 277.1 | 277.7 | 281.1 | 310.3 | 342.7 | 378.4 | 417.8 |
| Depreciation, % | 2.25 | 1.83 | 2.25 | 2.88 | 2.57 | 2.36 | 2.36 | 2.36 | 2.36 | 2.36 |
| EBIT | 573.8 | 1,104.5 | 51.9 | 219.5 | 302.1 | 542.4 | 598.9 | 661.2 | 730.1 | 806.2 |
| EBIT, % | 7.35 | 9.86 | 0.46219 | 2.28 | 2.8 | 4.55 | 4.55 | 4.55 | 4.55 | 4.55 |
| Total Cash | 823.8 | 742.8 | 593.7 | 703.1 | 335.6 | 784.0 | 865.6 | 955.8 | 1,055.3 | 1,165.3 |
| Total Cash, percent | .0 | .0 | .0 | .0 | .0 | .0 | .0 | .0 | .0 | .0 |
| Account Receivables | 991.0 | 1,145.8 | 1,298.8 | 490.1 | 985.1 | 1,160.9 | 1,281.8 | 1,415.4 | 1,562.8 | 1,725.6 |
| Account Receivables, % | 12.7 | 10.23 | 11.56 | 5.1 | 9.13 | 9.74 | 9.74 | 9.74 | 9.74 | 9.74 |
| Inventories | 940.2 | 1,302.2 | 1,428.3 | 1,380.3 | 1,569.4 | 1,555.9 | 1,718.0 | 1,897.0 | 2,094.5 | 2,312.7 |
| Inventories, % | 12.05 | 11.63 | 12.71 | 14.36 | 14.54 | 13.06 | 13.06 | 13.06 | 13.06 | 13.06 |
| Accounts Payable | 1,459.6 | 982.6 | 1,026.1 | 571.9 | 310.0 | 1,082.7 | 1,195.5 | 1,320.0 | 1,457.5 | 1,609.3 |
| Accounts Payable, % | 18.7 | 8.77 | 9.13 | 5.95 | 2.87 | 9.09 | 9.09 | 9.09 | 9.09 | 9.09 |
| Capital Expenditure | -464.0 | -749.8 | -591.0 | -549.6 | -217.2 | -610.8 | -674.4 | -744.7 | -822.2 | -907.9 |
| Capital Expenditure, % | -5.95 | -6.69 | -5.26 | -5.72 | -2.01 | -5.13 | -5.13 | -5.13 | -5.13 | -5.13 |
| Tax Rate, % | 33.85 | 33.85 | 33.85 | 33.85 | 33.85 | 33.85 | 33.85 | 33.85 | 33.85 | 33.85 |
| EBITAT | 411.3 | 843.1 | 146.3 | 165.6 | 199.8 | 422.6 | 466.7 | 515.3 | 568.9 | 628.2 |
| Depreciation | ||||||||||
| Changes in Account Receivables | ||||||||||
| Changes in Inventories | ||||||||||
| Changes in Accounts Payable | ||||||||||
| Capital Expenditure | ||||||||||
| UFCF | -348.5 | -695.3 | -427.0 | 295.7 | -685.6 | 703.2 | -67.6 | -74.7 | -82.5 | -91.1 |
| WACC, % | 5.01 | 5.08 | 5.42 | 5.07 | 4.93 | 5.1 | 5.1 | 5.1 | 5.1 | 5.1 |
| PV UFCF | ||||||||||
| SUM PV UFCF | 404.9 | |||||||||
| Long Term Growth Rate, % | 3.50 | |||||||||
| Free cash flow (T + 1) | -94 | |||||||||
| Terminal Value | -5,885 | |||||||||
| Present Terminal Value | -4,589 | |||||||||
| Enterprise Value | -4,184 | |||||||||
| Net Debt | 1,896 | |||||||||
| Equity Value | -6,080 | |||||||||
| Diluted Shares Outstanding, MM | 467 | |||||||||
| Equity Value Per Share | -13.03 |
What You Will Receive
- Real Zanyu Financials: Access comprehensive historical and projected data for precise valuation.
- Customizable Parameters: Adjust WACC, tax rates, revenue growth, and capital expenditures as needed.
- Automated Calculations: Intrinsic value and NPV are computed in real time.
- Scenario Analysis: Explore various scenarios to assess Zanyu Technology Group's potential performance.
- User-Friendly Design: Designed for industry professionals while remaining approachable for newcomers.
Key Features
- Comprehensive Real-Life Data: Pre-loaded with Zanyu Technology Group Co., Ltd.'s historical financials and future projections.
- Flexible Input Options: Modify revenue growth rates, profit margins, WACC, tax percentages, and capital expenditures to suit your analysis.
- Interactive Valuation Model: Automatically refreshes Net Present Value (NPV) and intrinsic value based on your customized inputs.
- Scenario Analysis: Develop various forecasting scenarios to explore a range of valuation results.
- Intuitive User Interface: Designed for ease of use, catering to both experienced professionals and newcomers.
How It Operates
- Download: Obtain the pre-formatted Excel file containing Zanyu Technology Group Co., Ltd.'s financial data.
- Customize: Modify forecasts, such as revenue growth, EBITDA %, and WACC.
- Update Automatically: Watch as intrinsic value and NPV calculations refresh in real-time.
- Test Scenarios: Generate various projections and compare results instantly.
- Make Decisions: Leverage the valuation outcomes to shape your investment strategy.
Why Choose Zanyu Technology Group's Calculator?
- Precision: Leverages accurate financial data from Zanyu Technology Group (002637SZ).
- Versatility: Tailored for users to easily experiment with and adjust inputs.
- Efficiency: Eliminate the need to create a DCF model from the ground up.
- Expert-Level: Crafted with the precision and functionality suitable for CFOs.
- Intuitive: Simple to navigate for users with varying levels of financial modeling expertise.
Who Can Benefit from This Product?
- Finance Students: Master valuation techniques and apply them using real-world data.
- Researchers: Integrate advanced financial models into your academic projects or studies.
- Investors: Validate your investment strategies and analyze valuation results for Zanyu Technology Group Co., Ltd. (002637SZ).
- Financial Analysts: Enhance your efficiency with a customizable and pre-built DCF model.
- Entrepreneurs: Discover the analytical methods used to evaluate large public companies like Zanyu Technology Group Co., Ltd. (002637SZ).
Contents of the Template
- Pre-Filled DCF Model: Zanyu Technology Group Co., Ltd.'s (002637SZ) financial data preloaded for immediate analysis.
- WACC Calculator: Comprehensive calculations for Weighted Average Cost of Capital tailored for Zanyu Technology.
- Financial Ratios: Assess Zanyu's profitability, leverage, and operational efficiency.
- Editable Inputs: Modify assumptions related to growth rates, margins, and CAPEX to align with your scenarios.
- Financial Statements: Annual and quarterly reports to facilitate in-depth analysis.
- Interactive Dashboard: Effortlessly visualize key valuation metrics and outcomes.
Disclaimer
All information, articles, and product details provided on this website are for general informational and educational purposes only. We do not claim any ownership over, nor do we intend to infringe upon, any trademarks, copyrights, logos, brand names, or other intellectual property mentioned or depicted on this site. Such intellectual property remains the property of its respective owners, and any references here are made solely for identification or informational purposes, without implying any affiliation, endorsement, or partnership.
We make no representations or warranties, express or implied, regarding the accuracy, completeness, or suitability of any content or products presented. Nothing on this website should be construed as legal, tax, investment, financial, medical, or other professional advice. In addition, no part of this site—including articles or product references—constitutes a solicitation, recommendation, endorsement, advertisement, or offer to buy or sell any securities, franchises, or other financial instruments, particularly in jurisdictions where such activity would be unlawful.
All content is of a general nature and may not address the specific circumstances of any individual or entity. It is not a substitute for professional advice or services. Any actions you take based on the information provided here are strictly at your own risk. You accept full responsibility for any decisions or outcomes arising from your use of this website and agree to release us from any liability in connection with your use of, or reliance upon, the content or products found herein.