
|
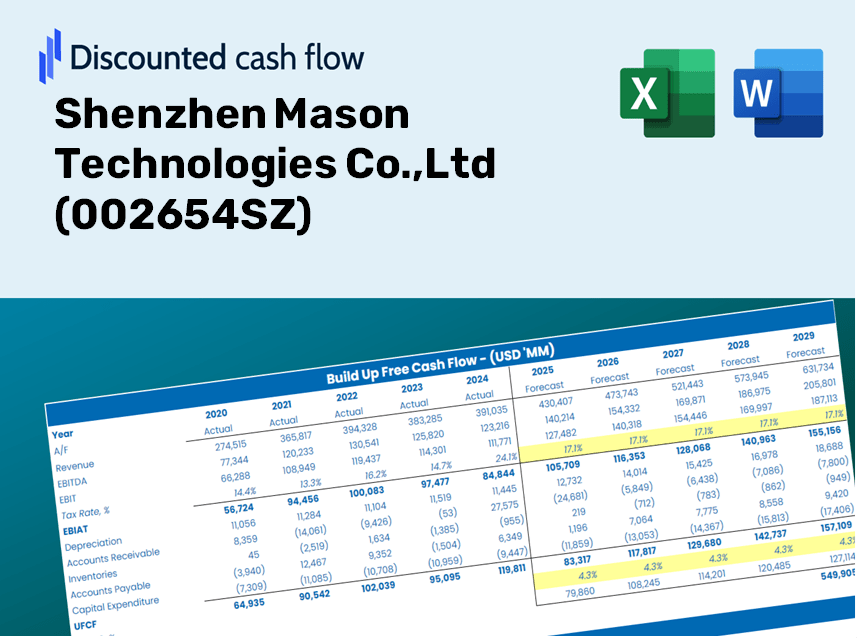
Shenzhen Mason Technologies Co.,Ltd (002654.SZ) DCF Valuation |
Fully Editable: Tailor To Your Needs In Excel Or Sheets
Professional Design: Trusted, Industry-Standard Templates
Investor-Approved Valuation Models
MAC/PC Compatible, Fully Unlocked
No Expertise Is Needed; Easy To Follow
Shenzhen Mason Technologies Co.,Ltd (002654.SZ) Bundle
Whether you’re an investor or analyst, this (002654SZ) DCF Calculator is your go-to resource for accurate valuation. Loaded with real data from Shenzhen Mason Technologies Co., Ltd, you can adjust forecasts and instantly observe the effects.
Discounted Cash Flow (DCF) - (USD MM)
| Year | AY1 2020 |
AY2 2021 |
AY3 2022 |
AY4 2023 |
AY5 2024 |
FY1 2025 |
FY2 2026 |
FY3 2027 |
FY4 2028 |
FY5 2029 |
|---|---|---|---|---|---|---|---|---|---|---|
| Revenue | 4,159.8 | 4,411.2 | 3,747.7 | 4,235.1 | 4,873.5 | 5,106.0 | 5,349.6 | 5,604.8 | 5,872.2 | 6,152.4 |
| Revenue Growth, % | 0 | 6.04 | -15.04 | 13.01 | 15.08 | 4.77 | 4.77 | 4.77 | 4.77 | 4.77 |
| EBITDA | 262.7 | 148.9 | -69.1 | 48.5 | 155.0 | 124.3 | 130.2 | 136.4 | 143.0 | 149.8 |
| EBITDA, % | 6.31 | 3.38 | -1.84 | 1.15 | 3.18 | 2.43 | 2.43 | 2.43 | 2.43 | 2.43 |
| Depreciation | 79.4 | 70.5 | 65.9 | 76.9 | 97.4 | 92.7 | 97.2 | 101.8 | 106.7 | 111.8 |
| Depreciation, % | 1.91 | 1.6 | 1.76 | 1.82 | 2 | 1.82 | 1.82 | 1.82 | 1.82 | 1.82 |
| EBIT | 183.2 | 78.4 | -135.0 | -28.4 | 57.5 | 31.6 | 33.1 | 34.6 | 36.3 | 38.0 |
| EBIT, % | 4.4 | 1.78 | -3.6 | -0.67153 | 1.18 | 0.61806 | 0.61806 | 0.61806 | 0.61806 | 0.61806 |
| Total Cash | 769.6 | 670.8 | 544.8 | 373.0 | 453.6 | 677.7 | 710.0 | 743.9 | 779.3 | 816.5 |
| Total Cash, percent | .0 | .0 | .0 | .0 | .0 | .0 | .0 | .0 | .0 | .0 |
| Account Receivables | 1,704.6 | 1,812.4 | 2,231.7 | 1,561.1 | 2,139.0 | 2,270.8 | 2,379.1 | 2,492.6 | 2,611.5 | 2,736.1 |
| Account Receivables, % | 40.98 | 41.09 | 59.55 | 36.86 | 43.89 | 44.47 | 44.47 | 44.47 | 44.47 | 44.47 |
| Inventories | 146.9 | 172.8 | 125.8 | 201.9 | 291.3 | 220.1 | 230.6 | 241.6 | 253.1 | 265.2 |
| Inventories, % | 3.53 | 3.92 | 3.36 | 4.77 | 5.98 | 4.31 | 4.31 | 4.31 | 4.31 | 4.31 |
| Accounts Payable | 875.8 | 730.6 | 1,409.7 | 812.6 | 1,100.1 | 1,194.7 | 1,251.7 | 1,311.4 | 1,374.0 | 1,439.6 |
| Accounts Payable, % | 21.05 | 16.56 | 37.62 | 19.19 | 22.57 | 23.4 | 23.4 | 23.4 | 23.4 | 23.4 |
| Capital Expenditure | -43.4 | -22.1 | -35.7 | -48.1 | -93.7 | -56.7 | -59.4 | -62.3 | -65.2 | -68.4 |
| Capital Expenditure, % | -1.04 | -0.50178 | -0.95222 | -1.14 | -1.92 | -1.11 | -1.11 | -1.11 | -1.11 | -1.11 |
| Tax Rate, % | -21.3 | -21.3 | -21.3 | -21.3 | -21.3 | -21.3 | -21.3 | -21.3 | -21.3 | -21.3 |
| EBITAT | 130.0 | 80.6 | -98.5 | -35.5 | 69.8 | 28.0 | 29.4 | 30.8 | 32.2 | 33.8 |
| Depreciation | ||||||||||
| Changes in Account Receivables | ||||||||||
| Changes in Inventories | ||||||||||
| Changes in Accounts Payable | ||||||||||
| Capital Expenditure | ||||||||||
| UFCF | -809.6 | -150.0 | 238.5 | -9.2 | -306.2 | 98.1 | 5.3 | 5.5 | 5.8 | 6.0 |
| WACC, % | 4.77 | 4.89 | 4.78 | 4.89 | 4.89 | 4.84 | 4.84 | 4.84 | 4.84 | 4.84 |
| PV UFCF | ||||||||||
| SUM PV UFCF | 112.6 | |||||||||
| Long Term Growth Rate, % | 4.00 | |||||||||
| Free cash flow (T + 1) | 6 | |||||||||
| Terminal Value | 745 | |||||||||
| Present Terminal Value | 588 | |||||||||
| Enterprise Value | 700 | |||||||||
| Net Debt | 508 | |||||||||
| Equity Value | 192 | |||||||||
| Diluted Shares Outstanding, MM | 896 | |||||||||
| Equity Value Per Share | 0.21 |
What You'll Receive
- Accurate 002654SZ Financial Data: Pre-populated with Shenzhen Mason Technologies' historical and forecasted data for detailed analysis.
- Completely Customizable Template: Easily adjust key inputs such as revenue growth, WACC, and EBITDA %.
- Instantaneous Calculations: Watch the intrinsic value of 002654SZ update instantly as you make changes.
- Professional Valuation Tool: Crafted for investors, analysts, and consultants in need of reliable DCF outcomes.
- Intuitive Design: User-friendly layout and straightforward instructions suitable for all levels of expertise.
Key Features
- Comprehensive Shenzhen Mason Data: Comes pre-loaded with the company’s historical financial performance and future projections.
- Customizable Input Options: Modify parameters such as revenue growth, profit margins, discount rates, tax percentages, and capital investment plans.
- Interactive Valuation Framework: Automatically recalculates Net Present Value (NPV) and intrinsic value based on your tailored inputs.
- What-If Analysis: Generate various forecast scenarios to explore differing valuation results.
- Intuitive Interface: Clean, organized, and suitable for both experienced professionals and newcomers.
How It Operates
- Download: Obtain the pre-configured Excel file containing Shenzhen Mason Technologies Co., Ltd's (002654SZ) financial data.
- Customize: Modify forecasts such as revenue growth, EBITDA margin, and WACC to fit your analysis.
- Update Automatically: The intrinsic value and NPV calculations refresh in real-time as you make adjustments.
- Test Scenarios: Develop various projections and instantly compare their potential outcomes.
- Make Decisions: Leverage the valuation findings to inform your investment approach.
Why Opt for Shenzhen Mason Technologies Co., Ltd (002654SZ) Calculator?
- Time-Saving: Skip the hassle of building a DCF model from the ground up – it’s ready for immediate use.
- Enhanced Accuracy: Dependable financial data and formulas minimize valuation errors.
- Completely Customizable: Adjust the model to fit your unique assumptions and forecasts.
- Simple to Analyze: Intuitive charts and outputs ensure results are easily interpretable.
- Endorsed by Professionals: Crafted for experts who prioritize accuracy and ease of use.
Who Can Benefit from Shenzhen Mason Technologies Co., Ltd (002654SZ)?
- Investors: Make informed choices with a top-tier valuation tool tailored for your needs.
- Financial Analysts: Enhance efficiency with a customizable DCF model at your fingertips.
- Consultants: Quickly modify the template for impactful client presentations or reports.
- Finance Enthusiasts: Expand your knowledge of valuation methods through practical examples.
- Educators and Students: Utilize it as a hands-on resource in finance-related educational programs.
What the Template Includes
- Operating and Balance Sheet Data: Pre-filled historical data and forecasts for Shenzhen Mason Technologies Co., Ltd (002654SZ), encompassing revenue, EBITDA, EBIT, and capital expenditures.
- WACC Calculation: A dedicated worksheet for calculating the Weighted Average Cost of Capital (WACC), featuring inputs such as Beta, risk-free rate, and share price.
- DCF Valuation (Unlevered and Levered): Customizable Discounted Cash Flow models that display intrinsic value with comprehensive calculations.
- Financial Statements: Pre-loaded annual and quarterly financial statements to facilitate in-depth analysis.
- Key Ratios: An overview of profitability, leverage, and efficiency ratios for Shenzhen Mason Technologies Co., Ltd (002654SZ).
- Dashboard and Charts: A visual summary of valuation results and underlying assumptions for simplified result analysis.
Disclaimer
All information, articles, and product details provided on this website are for general informational and educational purposes only. We do not claim any ownership over, nor do we intend to infringe upon, any trademarks, copyrights, logos, brand names, or other intellectual property mentioned or depicted on this site. Such intellectual property remains the property of its respective owners, and any references here are made solely for identification or informational purposes, without implying any affiliation, endorsement, or partnership.
We make no representations or warranties, express or implied, regarding the accuracy, completeness, or suitability of any content or products presented. Nothing on this website should be construed as legal, tax, investment, financial, medical, or other professional advice. In addition, no part of this site—including articles or product references—constitutes a solicitation, recommendation, endorsement, advertisement, or offer to buy or sell any securities, franchises, or other financial instruments, particularly in jurisdictions where such activity would be unlawful.
All content is of a general nature and may not address the specific circumstances of any individual or entity. It is not a substitute for professional advice or services. Any actions you take based on the information provided here are strictly at your own risk. You accept full responsibility for any decisions or outcomes arising from your use of this website and agree to release us from any liability in connection with your use of, or reliance upon, the content or products found herein.