
|
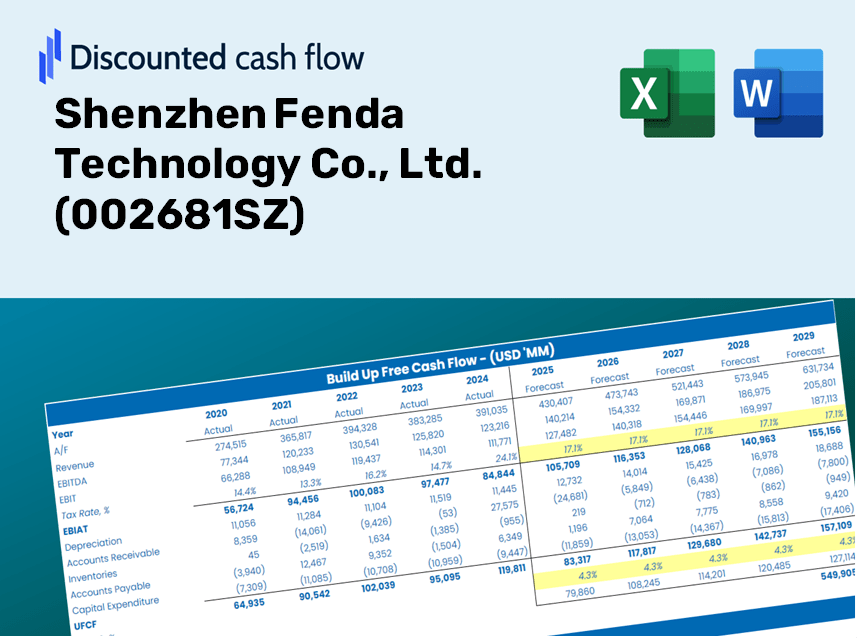
Shenzhen Fenda Technology Co., Ltd. (002681.SZ) DCF Valuation |
Fully Editable: Tailor To Your Needs In Excel Or Sheets
Professional Design: Trusted, Industry-Standard Templates
Investor-Approved Valuation Models
MAC/PC Compatible, Fully Unlocked
No Expertise Is Needed; Easy To Follow
Shenzhen Fenda Technology Co., Ltd. (002681.SZ) Bundle
Explore the financial prospects of Shenzhen Fenda Technology Co., Ltd. (002681SZ) with our user-friendly DCF Calculator! Enter your assumptions regarding growth, margins, and expenses to calculate the intrinsic value of Shenzhen Fenda Technology Co., Ltd. (002681SZ) and refine your investment strategy.
Discounted Cash Flow (DCF) - (USD MM)
| Year | AY1 2020 |
AY2 2021 |
AY3 2022 |
AY4 2023 |
AY5 2024 |
FY1 2025 |
FY2 2026 |
FY3 2027 |
FY4 2028 |
FY5 2029 |
|---|---|---|---|---|---|---|---|---|---|---|
| Revenue | 3,537.7 | 4,167.8 | 2,874.2 | 2,890.9 | 3,144.2 | 3,113.6 | 3,083.4 | 3,053.4 | 3,023.8 | 2,994.4 |
| Revenue Growth, % | 0 | 17.81 | -31.04 | 0.57954 | 8.76 | -0.97133 | -0.97133 | -0.97133 | -0.97133 | -0.97133 |
| EBITDA | 325.8 | -82.1 | 175.5 | 272.5 | 292.4 | 199.7 | 197.8 | 195.9 | 194.0 | 192.1 |
| EBITDA, % | 9.21 | -1.97 | 6.11 | 9.43 | 9.3 | 6.41 | 6.41 | 6.41 | 6.41 | 6.41 |
| Depreciation | 199.6 | 213.0 | 119.0 | 151.4 | 135.0 | 152.1 | 150.6 | 149.2 | 147.7 | 146.3 |
| Depreciation, % | 5.64 | 5.11 | 4.14 | 5.24 | 4.29 | 4.89 | 4.89 | 4.89 | 4.89 | 4.89 |
| EBIT | 126.2 | -295.1 | 56.5 | 121.1 | 157.4 | 47.6 | 47.2 | 46.7 | 46.2 | 45.8 |
| EBIT, % | 3.57 | -7.08 | 1.97 | 4.19 | 5.01 | 1.53 | 1.53 | 1.53 | 1.53 | 1.53 |
| Total Cash | 1,174.7 | 868.6 | 577.3 | 759.0 | 980.3 | 819.3 | 811.3 | 803.5 | 795.7 | 787.9 |
| Total Cash, percent | .0 | .0 | .0 | .0 | .0 | .0 | .0 | .0 | .0 | .0 |
| Account Receivables | 860.1 | 56.0 | 318.1 | 515.0 | 636.9 | 465.8 | 461.2 | 456.8 | 452.3 | 447.9 |
| Account Receivables, % | 24.31 | 1.34 | 11.07 | 17.81 | 20.26 | 14.96 | 14.96 | 14.96 | 14.96 | 14.96 |
| Inventories | 488.4 | 418.7 | 249.9 | 241.7 | 251.0 | 304.4 | 301.5 | 298.5 | 295.6 | 292.8 |
| Inventories, % | 13.81 | 10.05 | 8.69 | 8.36 | 7.98 | 9.78 | 9.78 | 9.78 | 9.78 | 9.78 |
| Accounts Payable | 1,175.2 | 1,197.8 | 598.7 | 514.9 | 756.7 | 776.3 | 768.8 | 761.3 | 753.9 | 746.6 |
| Accounts Payable, % | 33.22 | 28.74 | 20.83 | 17.81 | 24.07 | 24.93 | 24.93 | 24.93 | 24.93 | 24.93 |
| Capital Expenditure | -326.3 | -340.1 | -260.4 | -213.1 | -119.5 | -234.2 | -232.0 | -229.7 | -227.5 | -225.3 |
| Capital Expenditure, % | -9.22 | -8.16 | -9.06 | -7.37 | -3.8 | -7.52 | -7.52 | -7.52 | -7.52 | -7.52 |
| Tax Rate, % | 3.21 | 3.21 | 3.21 | 3.21 | 3.21 | 3.21 | 3.21 | 3.21 | 3.21 | 3.21 |
| EBITAT | 129.4 | 44.1 | 52.2 | 80.9 | 152.4 | 33.9 | 33.6 | 33.3 | 32.9 | 32.6 |
| Depreciation | ||||||||||
| Changes in Account Receivables | ||||||||||
| Changes in Inventories | ||||||||||
| Changes in Accounts Payable | ||||||||||
| Capital Expenditure | ||||||||||
| UFCF | -170.6 | 813.4 | -781.4 | -253.3 | 278.5 | 89.0 | -47.8 | -47.4 | -46.9 | -46.4 |
| WACC, % | 4.61 | 4.22 | 4.58 | 4.48 | 4.6 | 4.5 | 4.5 | 4.5 | 4.5 | 4.5 |
| PV UFCF | ||||||||||
| SUM PV UFCF | -76.7 | |||||||||
| Long Term Growth Rate, % | 3.00 | |||||||||
| Free cash flow (T + 1) | -48 | |||||||||
| Terminal Value | -3,193 | |||||||||
| Present Terminal Value | -2,562 | |||||||||
| Enterprise Value | -2,639 | |||||||||
| Net Debt | -39 | |||||||||
| Equity Value | -2,600 | |||||||||
| Diluted Shares Outstanding, MM | 1,942 | |||||||||
| Equity Value Per Share | -1.34 |
What You Will Receive
- Genuine 002681SZ Financials: Offers historical records and projected data for precise valuation.
- Customizable Parameters: Adjust WACC, tax rates, revenue growth, and capital expenditures as needed.
- Dynamic Calculations: Intrinsic value and NPV are automatically computed.
- Scenario Simulation: Evaluate various scenarios to assess Shenzhen Fenda Technology’s future performance.
- User-Friendly Design: Designed for industry professionals yet accessible for newcomers.
Key Features
- Customizable Forecast Inputs: Adjust vital parameters such as revenue growth, EBITDA percentage, and capital expenditures.
- Instant DCF Valuation: Automatically computes intrinsic value, NPV, and other metrics in real time.
- Industry-Leading Precision: Leverages Shenzhen Fenda Technology's actual financial data for accurate valuation results.
- Simplified Scenario Analysis: Effortlessly evaluate various assumptions and analyze different outcomes.
- Efficiency Booster: Remove the hassle of creating intricate valuation models from the ground up.
How It Functions
- Download the Template: Gain immediate access to the Excel-based Fenda DCF Calculator for Shenzhen Fenda Technology Co., Ltd. (002681SZ).
- Input Your Assumptions: Modify the yellow-highlighted cells to enter your projections for growth rates, WACC, margins, and more.
- Instant Calculations: The model will automatically refresh to display Fenda’s intrinsic value.
- Test Scenarios: Experiment with various assumptions to assess potential changes in valuation.
- Analyze and Decide: Utilize the results to inform your investment choices or financial evaluations.
Why Choose This Calculator for Shenzhen Fenda Technology Co., Ltd. (002681SZ)?
- Designed for Experts: A specialized tool utilized by investors, financial analysts, and industry consultants.
- Comprehensive Data: Historical and projected financial information for Shenzhen Fenda Technology Co., Ltd. preloaded for reliable analysis.
- Flexible Scenario Analysis: Effortlessly explore various forecasts and assumptions.
- Insightful Results: Automatically computes intrinsic value, NPV, and essential financial metrics.
- User-Friendly Interface: Clear, step-by-step instructions to simplify the process.
Who Can Benefit from This Product?
- Investors: Evaluate Shenzhen Fenda Technology Co., Ltd.'s (002681SZ) valuation prior to making stock trades.
- CFOs and Financial Analysts: Enhance valuation workflows and assess financial forecasts.
- Startup Founders: Understand the valuation methods used for established companies like Shenzhen Fenda Technology Co., Ltd. (002681SZ).
- Consultants: Provide comprehensive valuation reports to clients based on Shenzhen Fenda Technology Co., Ltd. (002681SZ).
- Students and Educators: Utilize real data to practice and teach valuation strategies relevant to Shenzhen Fenda Technology Co., Ltd. (002681SZ).
Contents of the Template
- Operating and Balance Sheet Data: Pre-filled historical data and projections for Shenzhen Fenda Technology Co., Ltd. (002681SZ), including revenue, EBITDA, EBIT, and capital expenditures.
- WACC Calculation: A dedicated sheet for calculating the Weighted Average Cost of Capital (WACC), featuring parameters such as Beta, risk-free rate, and share price.
- DCF Valuation (Unlevered and Levered): Customizable Discounted Cash Flow models that display intrinsic value alongside comprehensive calculations.
- Financial Statements: Pre-loaded annual and quarterly financial statements to facilitate in-depth analysis.
- Key Ratios: Includes profitability, leverage, and efficiency ratios relevant to Shenzhen Fenda Technology Co., Ltd. (002681SZ).
- Dashboard and Charts: A visual summary of valuation outputs and assumptions for easy analysis of results.
Disclaimer
All information, articles, and product details provided on this website are for general informational and educational purposes only. We do not claim any ownership over, nor do we intend to infringe upon, any trademarks, copyrights, logos, brand names, or other intellectual property mentioned or depicted on this site. Such intellectual property remains the property of its respective owners, and any references here are made solely for identification or informational purposes, without implying any affiliation, endorsement, or partnership.
We make no representations or warranties, express or implied, regarding the accuracy, completeness, or suitability of any content or products presented. Nothing on this website should be construed as legal, tax, investment, financial, medical, or other professional advice. In addition, no part of this site—including articles or product references—constitutes a solicitation, recommendation, endorsement, advertisement, or offer to buy or sell any securities, franchises, or other financial instruments, particularly in jurisdictions where such activity would be unlawful.
All content is of a general nature and may not address the specific circumstances of any individual or entity. It is not a substitute for professional advice or services. Any actions you take based on the information provided here are strictly at your own risk. You accept full responsibility for any decisions or outcomes arising from your use of this website and agree to release us from any liability in connection with your use of, or reliance upon, the content or products found herein.