
|
UTour Group Co., Ltd. (002707.SZ) DCF Valuation |
Fully Editable: Tailor To Your Needs In Excel Or Sheets
Professional Design: Trusted, Industry-Standard Templates
Investor-Approved Valuation Models
MAC/PC Compatible, Fully Unlocked
No Expertise Is Needed; Easy To Follow
UTour Group Co., Ltd. (002707.SZ) Bundle
Streamline your analysis and improve precision with our [002707SZ] DCF Calculator! Equipped with real data from UTour Group Co., Ltd. and customizable assumptions, this tool empowers you to forecast, evaluate, and appraise [Company] like a seasoned investor.
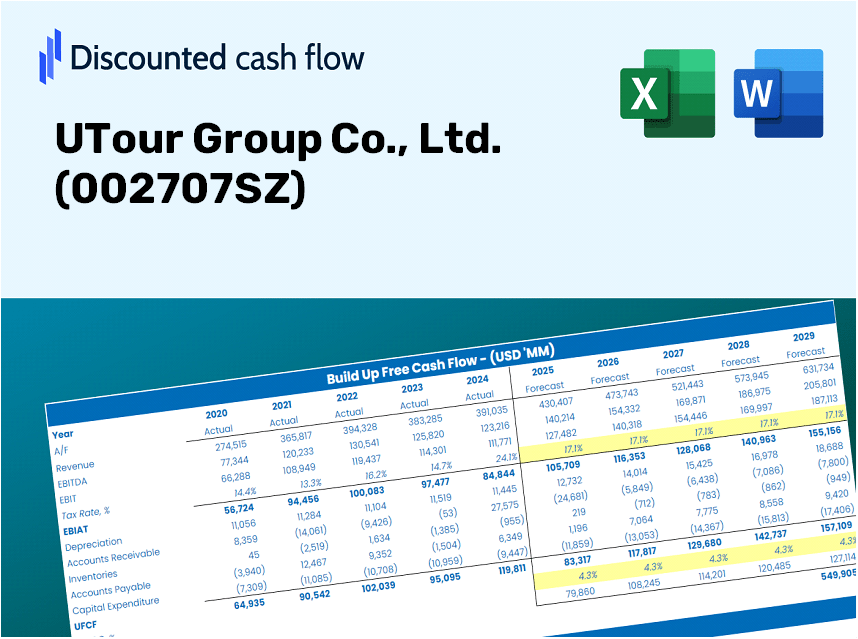
Discounted Cash Flow (DCF) - (USD MM)
| Year | AY1 2020 |
AY2 2021 |
AY3 2022 |
AY4 2023 |
AY5 2024 |
FY1 2025 |
FY2 2026 |
FY3 2027 |
FY4 2028 |
FY5 2029 |
|---|---|---|---|---|---|---|---|---|---|---|
| Revenue | 1,592.2 | 714.8 | 507.0 | 3,298.5 | 6,455.1 | 8,254.8 | 10,556.2 | 13,499.3 | 17,262.9 | 22,075.8 |
| Revenue Growth, % | 0 | -55.1 | -29.08 | 550.6 | 95.7 | 27.88 | 27.88 | 27.88 | 27.88 | 27.88 |
| EBITDA | -880.9 | -407.2 | -174.2 | 37.4 | 177.3 | -2,357.1 | -3,014.2 | -3,854.6 | -4,929.2 | -6,303.5 |
| EBITDA, % | -55.33 | -56.97 | -34.35 | 1.14 | 2.75 | -28.55 | -28.55 | -28.55 | -28.55 | -28.55 |
| Depreciation | 40.3 | 32.6 | 8.1 | 7.6 | 7.9 | 149.2 | 190.8 | 243.9 | 312.0 | 398.9 |
| Depreciation, % | 2.53 | 4.56 | 1.59 | 0.23098 | 0.1217 | 1.81 | 1.81 | 1.81 | 1.81 | 1.81 |
| EBIT | -921.2 | -439.8 | -182.2 | 29.8 | 169.5 | -2,506.2 | -3,205.0 | -4,098.5 | -5,241.2 | -6,702.4 |
| EBIT, % | -57.86 | -61.53 | -35.95 | 0.90403 | 2.63 | -30.36 | -30.36 | -30.36 | -30.36 | -30.36 |
| Total Cash | 1,053.0 | 758.2 | 674.0 | 642.1 | 646.8 | 4,880.6 | 6,241.3 | 7,981.4 | 10,206.6 | 13,052.2 |
| Total Cash, percent | .0 | .0 | .0 | .0 | .0 | .0 | .0 | .0 | .0 | .0 |
| Account Receivables | 349.0 | 255.0 | 165.3 | 409.1 | 377.5 | 1,790.4 | 2,289.6 | 2,928.0 | 3,744.3 | 4,788.2 |
| Account Receivables, % | 21.92 | 35.67 | 32.61 | 12.4 | 5.85 | 21.69 | 21.69 | 21.69 | 21.69 | 21.69 |
| Inventories | 4.8 | 2.1 | 2.0 | 8.6 | 10.2 | 23.1 | 29.5 | 37.7 | 48.3 | 61.7 |
| Inventories, % | 0.30133 | 0.288 | 0.38914 | 0.26221 | 0.15731 | 0.2796 | 0.2796 | 0.2796 | 0.2796 | 0.2796 |
| Accounts Payable | 609.0 | 416.5 | 263.2 | 396.6 | 425.6 | 2,757.6 | 3,526.5 | 4,509.6 | 5,766.9 | 7,374.7 |
| Accounts Payable, % | 38.25 | 58.26 | 51.91 | 12.02 | 6.59 | 33.41 | 33.41 | 33.41 | 33.41 | 33.41 |
| Capital Expenditure | -22.7 | -7.7 | -5.1 | -32.7 | -42.7 | -85.3 | -109.0 | -139.4 | -178.3 | -228.0 |
| Capital Expenditure, % | -1.42 | -1.08 | -1.01 | -0.99286 | -0.66219 | -1.03 | -1.03 | -1.03 | -1.03 | -1.03 |
| Tax Rate, % | 41.44 | 41.44 | 41.44 | 41.44 | 41.44 | 41.44 | 41.44 | 41.44 | 41.44 | 41.44 |
| EBITAT | -740.6 | -316.4 | -156.2 | 15.4 | 99.2 | -1,745.6 | -2,232.3 | -2,854.6 | -3,650.5 | -4,668.2 |
| Depreciation | ||||||||||
| Changes in Account Receivables | ||||||||||
| Changes in Inventories | ||||||||||
| Changes in Accounts Payable | ||||||||||
| Capital Expenditure | ||||||||||
| UFCF | -467.8 | -387.2 | -216.8 | -126.8 | 123.6 | -775.6 | -1,887.3 | -2,413.5 | -3,086.4 | -3,946.8 |
| WACC, % | 6.15 | 6.11 | 6.17 | 6.04 | 6.07 | 6.11 | 6.11 | 6.11 | 6.11 | 6.11 |
| PV UFCF | ||||||||||
| SUM PV UFCF | -9,797.1 | |||||||||
| Long Term Growth Rate, % | 2.00 | |||||||||
| Free cash flow (T + 1) | -4,026 | |||||||||
| Terminal Value | -98,040 | |||||||||
| Present Terminal Value | -72,895 | |||||||||
| Enterprise Value | -82,692 | |||||||||
| Net Debt | -416 | |||||||||
| Equity Value | -82,275 | |||||||||
| Diluted Shares Outstanding, MM | 981 | |||||||||
| Equity Value Per Share | -83.89 |
What You Will Receive
- Genuine UTour Group Data: Comprehensive financial metrics – including revenue and EBIT – derived from actual and projected data.
- Complete Customization: Modify all key parameters (yellow cells) such as WACC, growth %, and tax rates.
- Immediate Valuation Updates: Automatic recalculations to assess the effects of changes on UTour Group’s fair value.
- Flexible Excel Template: Designed for quick adjustments, scenario analysis, and in-depth forecasting.
- Efficient and Precise: Avoid constructing models from the ground up while ensuring accuracy and adaptability.
Key Features
- Pre-Loaded Data: UTour Group Co., Ltd.'s historical financial statements and pre-filled forecasts.
- Fully Adjustable Inputs: Customize WACC, tax rates, revenue growth, and EBITDA margins as needed.
- Instant Results: Witness UTour Group Co., Ltd.'s intrinsic value update in real time.
- Clear Visual Outputs: Dashboard charts present valuation outcomes and essential metrics.
- Built for Accuracy: A professional-grade tool designed for analysts, investors, and finance professionals.
How It Works
- Step 1: Download the Excel file.
- Step 2: Review UTour Group Co., Ltd.'s (002707SZ) pre-filled financial data and projections.
- Step 3: Adjust key inputs such as revenue growth, WACC, and tax rates (highlighted cells).
- Step 4: Observe the DCF model refresh in real-time as you modify your assumptions.
- Step 5: Evaluate the outputs and leverage the results for your investment strategies.
Reasons to Use the UTour Group Co., Ltd. ([002707SZ]) Calculator
- Time Efficiency: Skip the hassle of building a DCF model from the ground up – it's ready for immediate use.
- Enhanced Accuracy: Dependable financial data and formulas minimize valuation errors.
- Completely Customizable: Adjust the model to align with your unique assumptions and forecasts.
- User-Friendly Interpretation: Intuitive charts and outputs simplify result analysis.
- Favored by Professionals: Created for users who prioritize precision and functionality.
Who Can Benefit from UTour Group Co., Ltd. (002707SZ)?
- Tourism Students: Explore industry trends and hone your skills using real-world examples.
- Researchers: Utilize industry-specific data and insights for scholarly work or projects.
- Investors: Validate your investment strategies and evaluate the market performance of UTour Group Co., Ltd. (002707SZ).
- Market Analysts: Enhance your analysis with a tailored model designed for the tourism sector.
- Entrepreneurs: Discover best practices and analytical frameworks used by established companies like UTour Group Co., Ltd. (002707SZ).
Contents of the Template
- Comprehensive DCF Model: An editable template featuring intricate valuation calculations.
- Real-World Data: Historical and projected financials for UTour Group Co., Ltd. (002707SZ) preloaded for your analysis.
- Customizable Parameters: Modify WACC, growth rates, and tax assumptions to explore various scenarios.
- Financial Statements: Complete annual and quarterly breakdowns for enhanced insights.
- Key Ratios: Integrated analysis for profitability, efficiency, and leverage metrics.
- Dashboard with Visual Outputs: Graphs and tables that present clear, actionable results.
Disclaimer
All information, articles, and product details provided on this website are for general informational and educational purposes only. We do not claim any ownership over, nor do we intend to infringe upon, any trademarks, copyrights, logos, brand names, or other intellectual property mentioned or depicted on this site. Such intellectual property remains the property of its respective owners, and any references here are made solely for identification or informational purposes, without implying any affiliation, endorsement, or partnership.
We make no representations or warranties, express or implied, regarding the accuracy, completeness, or suitability of any content or products presented. Nothing on this website should be construed as legal, tax, investment, financial, medical, or other professional advice. In addition, no part of this site—including articles or product references—constitutes a solicitation, recommendation, endorsement, advertisement, or offer to buy or sell any securities, franchises, or other financial instruments, particularly in jurisdictions where such activity would be unlawful.
All content is of a general nature and may not address the specific circumstances of any individual or entity. It is not a substitute for professional advice or services. Any actions you take based on the information provided here are strictly at your own risk. You accept full responsibility for any decisions or outcomes arising from your use of this website and agree to release us from any liability in connection with your use of, or reliance upon, the content or products found herein.