
|
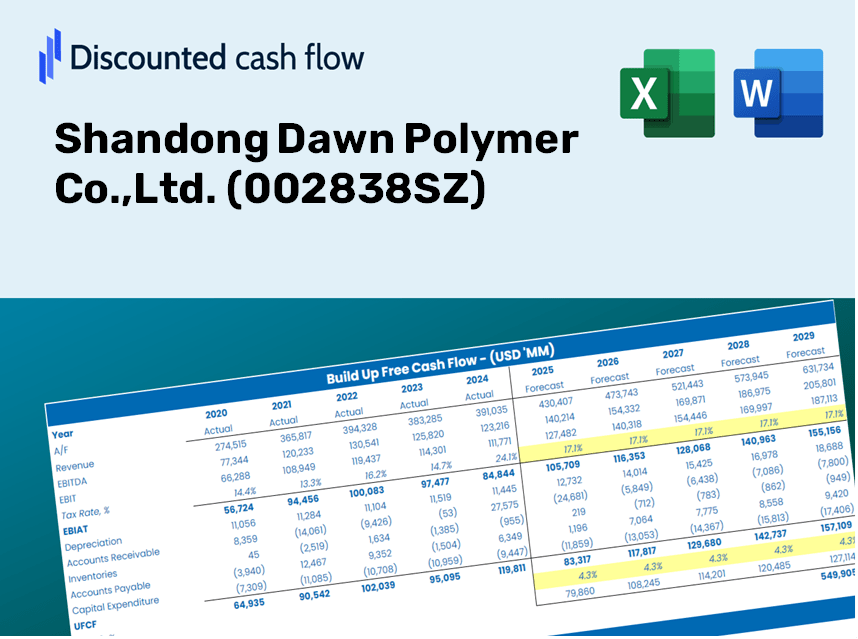
Shandong Dawn Polymer Co.,Ltd. (002838.SZ) DCF Valuation |
Fully Editable: Tailor To Your Needs In Excel Or Sheets
Professional Design: Trusted, Industry-Standard Templates
Investor-Approved Valuation Models
MAC/PC Compatible, Fully Unlocked
No Expertise Is Needed; Easy To Follow
Shandong Dawn Polymer Co.,Ltd. (002838.SZ) Bundle
Enhance your investment strategy with the (002838SZ) DCF Calculator! Utilize authentic financial data for Shandong Dawn Polymer Co., Ltd., adjust growth projections and expenses, and instantly observe how these modifications affect the intrinsic value of (002838SZ).
Discounted Cash Flow (DCF) - (USD MM)
| Year | AY1 2020 |
AY2 2021 |
AY3 2022 |
AY4 2023 |
AY5 2024 |
FY1 2025 |
FY2 2026 |
FY3 2027 |
FY4 2028 |
FY5 2029 |
|---|---|---|---|---|---|---|---|---|---|---|
| Revenue | 4,422.3 | 4,261.1 | 4,525.7 | 4,544.1 | 5,300.8 | 5,560.8 | 5,833.6 | 6,119.7 | 6,419.9 | 6,734.9 |
| Revenue Growth, % | 0 | -3.64 | 6.21 | 0.40592 | 16.65 | 4.91 | 4.91 | 4.91 | 4.91 | 4.91 |
| EBITDA | 972.7 | 327.2 | 218.4 | 272.9 | 314.3 | 516.4 | 541.8 | 568.4 | 596.2 | 625.5 |
| EBITDA, % | 21.99 | 7.68 | 4.83 | 6.01 | 5.93 | 9.29 | 9.29 | 9.29 | 9.29 | 9.29 |
| Depreciation | 68.0 | 75.0 | 84.4 | 97.0 | 136.5 | 109.8 | 115.2 | 120.8 | 126.8 | 133.0 |
| Depreciation, % | 1.54 | 1.76 | 1.86 | 2.14 | 2.58 | 1.97 | 1.97 | 1.97 | 1.97 | 1.97 |
| EBIT | 904.7 | 252.3 | 134.0 | 175.9 | 177.8 | 406.6 | 426.6 | 447.5 | 469.5 | 492.5 |
| EBIT, % | 20.46 | 5.92 | 2.96 | 3.87 | 3.35 | 7.31 | 7.31 | 7.31 | 7.31 | 7.31 |
| Total Cash | 593.9 | 359.7 | 823.7 | 531.9 | 502.4 | 681.2 | 714.7 | 749.7 | 786.5 | 825.1 |
| Total Cash, percent | .0 | .0 | .0 | .0 | .0 | .0 | .0 | .0 | .0 | .0 |
| Account Receivables | 896.0 | 1,029.2 | 1,716.8 | 1,840.5 | 2,506.5 | 1,892.2 | 1,985.0 | 2,082.4 | 2,184.5 | 2,291.7 |
| Account Receivables, % | 20.26 | 24.15 | 37.94 | 40.5 | 47.29 | 34.03 | 34.03 | 34.03 | 34.03 | 34.03 |
| Inventories | 393.7 | 443.6 | 535.0 | 565.9 | 786.3 | 649.7 | 681.6 | 715.0 | 750.1 | 786.9 |
| Inventories, % | 8.9 | 10.41 | 11.82 | 12.45 | 14.83 | 11.68 | 11.68 | 11.68 | 11.68 | 11.68 |
| Accounts Payable | 64.7 | 277.3 | 194.0 | 359.4 | 371.7 | 302.3 | 317.1 | 332.7 | 349.0 | 366.1 |
| Accounts Payable, % | 1.46 | 6.51 | 4.29 | 7.91 | 7.01 | 5.44 | 5.44 | 5.44 | 5.44 | 5.44 |
| Capital Expenditure | -187.9 | -229.6 | -385.7 | -245.4 | -234.8 | -311.3 | -326.6 | -342.6 | -359.4 | -377.0 |
| Capital Expenditure, % | -4.25 | -5.39 | -8.52 | -5.4 | -4.43 | -5.6 | -5.6 | -5.6 | -5.6 | -5.6 |
| Tax Rate, % | 11.83 | 11.83 | 11.83 | 11.83 | 11.83 | 11.83 | 11.83 | 11.83 | 11.83 | 11.83 |
| EBITAT | 772.8 | 214.2 | 121.0 | 145.5 | 156.8 | 351.0 | 368.2 | 386.3 | 405.2 | 425.1 |
| Depreciation | ||||||||||
| Changes in Account Receivables | ||||||||||
| Changes in Inventories | ||||||||||
| Changes in Accounts Payable | ||||||||||
| Capital Expenditure | ||||||||||
| UFCF | -572.0 | 89.0 | -1,042.7 | 8.1 | -815.7 | 830.9 | 47.0 | 49.3 | 51.7 | 54.2 |
| WACC, % | 4.78 | 4.78 | 4.8 | 4.77 | 4.79 | 4.78 | 4.78 | 4.78 | 4.78 | 4.78 |
| PV UFCF | ||||||||||
| SUM PV UFCF | 964.4 | |||||||||
| Long Term Growth Rate, % | 3.50 | |||||||||
| Free cash flow (T + 1) | 56 | |||||||||
| Terminal Value | 4,375 | |||||||||
| Present Terminal Value | 3,464 | |||||||||
| Enterprise Value | 4,428 | |||||||||
| Net Debt | 906 | |||||||||
| Equity Value | 3,522 | |||||||||
| Diluted Shares Outstanding, MM | 440 | |||||||||
| Equity Value Per Share | 8.01 |
Benefits You Will Receive
- Comprehensive Financial Model: Utilize Shandong Dawn Polymer's actual data for accurate DCF valuation.
- Complete Forecast Customization: Modify revenue growth, profit margins, WACC, and other vital parameters.
- Real-Time Calculations: Instant updates allow you to see outcomes as you make adjustments.
- Professional-Grade Template: An expertly crafted Excel file ready for investment presentations.
- Adaptable and Reusable: Designed for flexibility, enabling repeated application for in-depth forecasts.
Key Features
- Real-Time SDPC Data: Comes pre-loaded with Shandong Dawn Polymer's historical financial performance and future projections.
- Customizable Inputs: Modify key parameters such as revenue growth, profit margins, WACC, tax rates, and capital expenditures.
- Advanced Valuation Model: Automatically adjusts Net Present Value (NPV) and intrinsic value according to your specified inputs.
- Scenario Analysis: Develop various forecasting scenarios to assess a range of valuation possibilities.
- User-Centric Interface: Intuitive and structured layout designed for both seasoned professionals and newcomers.
How It Functions
- Download the Template: Gain immediate access to the Excel-based Shandong Dawn DCF Calculator for [002838SZ].
- Input Your Assumptions: Modify the yellow-highlighted cells for growth rates, WACC, margins, and other variables.
- Instant Calculations: The model automatically calculates the intrinsic value of Shandong Dawn Polymer.
- Test Scenarios: Experiment with various assumptions to assess potential changes in valuation.
- Analyze and Decide: Utilize the findings to inform your investment or financial strategy.
Why Choose Our Financial Calculator for Shandong Dawn Polymer Co., Ltd. (002838SZ)?
- Precision: Utilizes real financial data from Shandong Dawn Polymer for enhanced accuracy.
- Customizable: Users can easily adjust inputs to suit their specific scenarios.
- Efficiency: Avoid the complexities of creating a financial model from the ground up.
- Expert-Level: Crafted with the insights and standards expected by industry professionals.
- Intuitive: Designed for ease of use, catering to users with varying levels of financial expertise.
Who Should Use This Product?
- Individual Investors: Gain insights for making informed decisions about trading Shandong Dawn Polymer Co., Ltd. (002838SZ) stock.
- Financial Analysts: Enhance valuation methodologies with comprehensive financial models tailored for Shandong Dawn Polymer Co., Ltd. (002838SZ).
- Consultants: Provide clients with accurate and timely valuation analyses related to Shandong Dawn Polymer Co., Ltd. (002838SZ).
- Business Owners: Learn how prominent companies like Shandong Dawn Polymer Co., Ltd. (002838SZ) are valued to inform your strategic planning.
- Finance Students: Explore valuation techniques through real-life data and scenarios involving Shandong Dawn Polymer Co., Ltd. (002838SZ).
Contents of the Template
- Operating and Balance Sheet Data: Pre-filled historical data and forecasts for Shandong Dawn Polymer Co., Ltd. (002838SZ), including metrics like revenue, EBITDA, EBIT, and capital expenditures.
- WACC Calculation: A dedicated sheet for calculating the Weighted Average Cost of Capital (WACC), incorporating elements such as Beta, risk-free rate, and share price.
- DCF Valuation (Unlevered and Levered): Customizable Discounted Cash Flow models that present intrinsic value along with comprehensive calculations.
- Financial Statements: Pre-loaded annual and quarterly financial statements to aid in the analysis.
- Key Ratios: Detailed profitability, leverage, and efficiency ratios specifically for Shandong Dawn Polymer Co., Ltd. (002838SZ).
- Dashboard and Charts: Visual representations of valuation outputs and assumptions for straightforward result analysis.
Disclaimer
All information, articles, and product details provided on this website are for general informational and educational purposes only. We do not claim any ownership over, nor do we intend to infringe upon, any trademarks, copyrights, logos, brand names, or other intellectual property mentioned or depicted on this site. Such intellectual property remains the property of its respective owners, and any references here are made solely for identification or informational purposes, without implying any affiliation, endorsement, or partnership.
We make no representations or warranties, express or implied, regarding the accuracy, completeness, or suitability of any content or products presented. Nothing on this website should be construed as legal, tax, investment, financial, medical, or other professional advice. In addition, no part of this site—including articles or product references—constitutes a solicitation, recommendation, endorsement, advertisement, or offer to buy or sell any securities, franchises, or other financial instruments, particularly in jurisdictions where such activity would be unlawful.
All content is of a general nature and may not address the specific circumstances of any individual or entity. It is not a substitute for professional advice or services. Any actions you take based on the information provided here are strictly at your own risk. You accept full responsibility for any decisions or outcomes arising from your use of this website and agree to release us from any liability in connection with your use of, or reliance upon, the content or products found herein.