
|
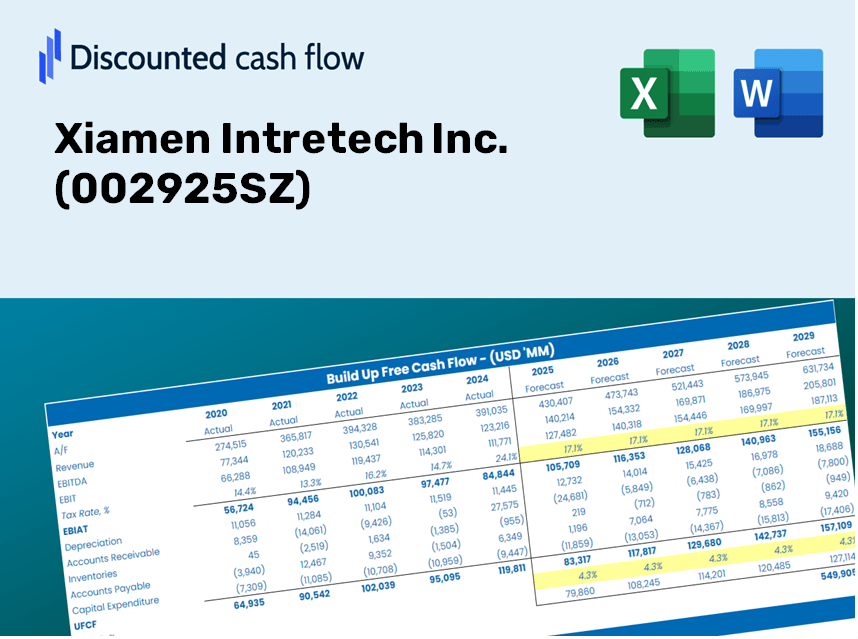
Xiamen Intretech Inc. (002925.SZ) DCF Valuation |
Fully Editable: Tailor To Your Needs In Excel Or Sheets
Professional Design: Trusted, Industry-Standard Templates
Investor-Approved Valuation Models
MAC/PC Compatible, Fully Unlocked
No Expertise Is Needed; Easy To Follow
Xiamen Intretech Inc. (002925.SZ) Bundle
As an investor or analyst, this DCF Calculator for Xiamen Intretech Inc. (002925SZ) is your go-to resource for accurate valuation. It comes preloaded with real data from Xiamen Intretech Inc., allowing you to adjust forecasts and observe the effects in real-time.
Discounted Cash Flow (DCF) - (USD MM)
| Year | AY1 2020 |
AY2 2021 |
AY3 2022 |
AY4 2023 |
AY5 2024 |
FY1 2025 |
FY2 2026 |
FY3 2027 |
FY4 2028 |
FY5 2029 |
|---|---|---|---|---|---|---|---|---|---|---|
| Revenue | 5,317.4 | 7,061.0 | 4,345.2 | 3,860.2 | 3,572.8 | 3,355.9 | 3,152.2 | 2,960.8 | 2,781.1 | 2,612.3 |
| Revenue Growth, % | 0 | 32.79 | -38.46 | -11.16 | -7.45 | -6.07 | -6.07 | -6.07 | -6.07 | -6.07 |
| EBITDA | 1,294.7 | 1,313.4 | 705.3 | 601.3 | 406.2 | 578.1 | 543.0 | 510.0 | 479.1 | 450.0 |
| EBITDA, % | 24.35 | 18.6 | 16.23 | 15.58 | 11.37 | 17.23 | 17.23 | 17.23 | 17.23 | 17.23 |
| Depreciation | 107.7 | 164.3 | 133.0 | 146.1 | 162.1 | 105.6 | 99.2 | 93.2 | 87.5 | 82.2 |
| Depreciation, % | 2.02 | 2.33 | 3.06 | 3.78 | 4.54 | 3.15 | 3.15 | 3.15 | 3.15 | 3.15 |
| EBIT | 1,187.0 | 1,149.1 | 572.3 | 455.2 | 244.1 | 472.4 | 443.8 | 416.8 | 391.5 | 367.8 |
| EBIT, % | 22.32 | 16.27 | 13.17 | 11.79 | 6.83 | 14.08 | 14.08 | 14.08 | 14.08 | 14.08 |
| Total Cash | 2,470.0 | 2,915.5 | 2,777.5 | 1,985.5 | 995.2 | 1,550.1 | 1,456.0 | 1,367.6 | 1,284.6 | 1,206.6 |
| Total Cash, percent | .0 | .0 | .0 | .0 | .0 | .0 | .0 | .0 | .0 | .0 |
| Account Receivables | 2,011.6 | 1,626.2 | 1,242.3 | 1,212.7 | 1,347.7 | 1,064.4 | 999.8 | 939.1 | 882.1 | 828.5 |
| Account Receivables, % | 37.83 | 23.03 | 28.59 | 31.41 | 37.72 | 31.72 | 31.72 | 31.72 | 31.72 | 31.72 |
| Inventories | 1,021.3 | 1,251.7 | 863.0 | 788.6 | 758.4 | 660.8 | 620.7 | 583.0 | 547.6 | 514.4 |
| Inventories, % | 19.21 | 17.73 | 19.86 | 20.43 | 21.23 | 19.69 | 19.69 | 19.69 | 19.69 | 19.69 |
| Accounts Payable | 1,451.6 | 1,078.6 | 710.3 | 647.9 | 749.6 | 648.9 | 609.5 | 572.5 | 537.8 | 505.1 |
| Accounts Payable, % | 27.3 | 15.28 | 16.35 | 16.78 | 20.98 | 19.34 | 19.34 | 19.34 | 19.34 | 19.34 |
| Capital Expenditure | -202.8 | -475.3 | -504.6 | -475.4 | -534.3 | -331.7 | -311.6 | -292.7 | -274.9 | -258.2 |
| Capital Expenditure, % | -3.81 | -6.73 | -11.61 | -12.31 | -14.96 | -9.89 | -9.89 | -9.89 | -9.89 | -9.89 |
| Tax Rate, % | 14.04 | 14.04 | 14.04 | 14.04 | 14.04 | 14.04 | 14.04 | 14.04 | 14.04 | 14.04 |
| EBITAT | 975.0 | 987.0 | 504.2 | 380.7 | 209.8 | 402.3 | 377.9 | 354.9 | 333.4 | 313.2 |
| Depreciation | ||||||||||
| Changes in Account Receivables | ||||||||||
| Changes in Inventories | ||||||||||
| Changes in Accounts Payable | ||||||||||
| Capital Expenditure | ||||||||||
| UFCF | -701.4 | 458.1 | 536.9 | 93.0 | -165.4 | 456.4 | 230.8 | 216.8 | 203.6 | 191.3 |
| WACC, % | 7.51 | 7.51 | 7.52 | 7.51 | 7.51 | 7.51 | 7.51 | 7.51 | 7.51 | 7.51 |
| PV UFCF | ||||||||||
| SUM PV UFCF | 1,084.2 | |||||||||
| Long Term Growth Rate, % | 3.50 | |||||||||
| Free cash flow (T + 1) | 198 | |||||||||
| Terminal Value | 4,933 | |||||||||
| Present Terminal Value | 3,434 | |||||||||
| Enterprise Value | 4,519 | |||||||||
| Net Debt | -512 | |||||||||
| Equity Value | 5,031 | |||||||||
| Diluted Shares Outstanding, MM | 762 | |||||||||
| Equity Value Per Share | 6.60 |
Benefits You Will Receive
- Customizable Excel Template: An adaptable Excel-based DCF Calculator featuring pre-populated financial data for Xiamen Intretech Inc. (002925SZ).
- Comprehensive Data: Access to historical figures and future projections (displayed in the highlighted cells).
- Adjustable Forecasts: Modify key assumptions such as revenue growth, EBITDA percentage, and WACC.
- Instant Calculations: Observe the immediate effects of your inputs on the valuation of Xiamen Intretech Inc. (002925SZ).
- Professional Resource: Designed for investors, CFOs, consultants, and financial analysts.
- User-Centric Layout: Organized for simplicity and efficiency, complete with detailed instructions.
Key Features
- Customizable Forecast Inputs: Adjust essential parameters such as revenue growth rate, EBITDA margin, and capital expenditures.
- Instant DCF Valuation: Quickly computes intrinsic value, net present value, and related outputs.
- High-Precision Accuracy: Leverages Xiamen Intretech Inc.'s real-world financials for credible valuation results.
- Effortless Scenario Analysis: Easily explore various assumptions and assess different outcomes.
- Efficiency Enhancer: Streamlines the valuation process by removing the need for complex model construction.
How It Functions
- Download: Obtain the pre-configured Excel file containing Xiamen Intretech Inc.'s (002925SZ) financial data.
- Customize: Modify forecasts, such as revenue growth, EBITDA percentage, and WACC.
- Real-Time Updates: The intrinsic value and NPV calculations refresh automatically as data changes.
- Evaluate Scenarios: Generate various projections and instantly compare their outcomes.
- Make Informed Decisions: Leverage the valuation insights to shape your investment approach.
Why Choose This Calculator for Xiamen Intretech Inc. (002925SZ)?
- Reliable Data: Utilizing accurate financial information from Xiamen Intretech ensures trustworthy valuation outcomes.
- Customizable Features: Tailor key variables such as growth rates, WACC, and tax rates to align with your forecasts.
- Efficient: Built-in calculations save you the hassle of starting from scratch.
- Professional Quality: Crafted for investors, analysts, and consultants alike.
- Easy to Use: User-friendly design with clear instructions makes it accessible for everyone.
Who Can Benefit from This Product?
- Professional Investors: Develop comprehensive and trustworthy valuation models for analyzing portfolios related to Xiamen Intretech Inc. (002925SZ).
- Corporate Finance Departments: Evaluate valuation scenarios to inform strategic planning within the organization.
- Consultants and Advisors: Deliver precise valuation insights for clients interested in Xiamen Intretech Inc. (002925SZ).
- Students and Educators: Leverage real-world data to enhance financial modeling skills and education.
- Technology Enthusiasts: Gain insights into how tech firms like Xiamen Intretech Inc. (002925SZ) are assessed in the financial market.
Contents of the Template
- Pre-Filled Data: Contains historical financial data and forecasts for Xiamen Intretech Inc. (002925SZ).
- Discounted Cash Flow Model: An editable DCF valuation model featuring automatic calculations.
- Weighted Average Cost of Capital (WACC): A specific sheet for calculating WACC using customized inputs.
- Key Financial Ratios: Assess Xiamen Intretech's profitability, efficiency, and capital structure.
- Customizable Inputs: Easily modify revenue growth, profit margins, and tax rates.
- Clear Dashboard: Visual representations and tables that summarize essential valuation outcomes.
Disclaimer
All information, articles, and product details provided on this website are for general informational and educational purposes only. We do not claim any ownership over, nor do we intend to infringe upon, any trademarks, copyrights, logos, brand names, or other intellectual property mentioned or depicted on this site. Such intellectual property remains the property of its respective owners, and any references here are made solely for identification or informational purposes, without implying any affiliation, endorsement, or partnership.
We make no representations or warranties, express or implied, regarding the accuracy, completeness, or suitability of any content or products presented. Nothing on this website should be construed as legal, tax, investment, financial, medical, or other professional advice. In addition, no part of this site—including articles or product references—constitutes a solicitation, recommendation, endorsement, advertisement, or offer to buy or sell any securities, franchises, or other financial instruments, particularly in jurisdictions where such activity would be unlawful.
All content is of a general nature and may not address the specific circumstances of any individual or entity. It is not a substitute for professional advice or services. Any actions you take based on the information provided here are strictly at your own risk. You accept full responsibility for any decisions or outcomes arising from your use of this website and agree to release us from any liability in connection with your use of, or reliance upon, the content or products found herein.