
|
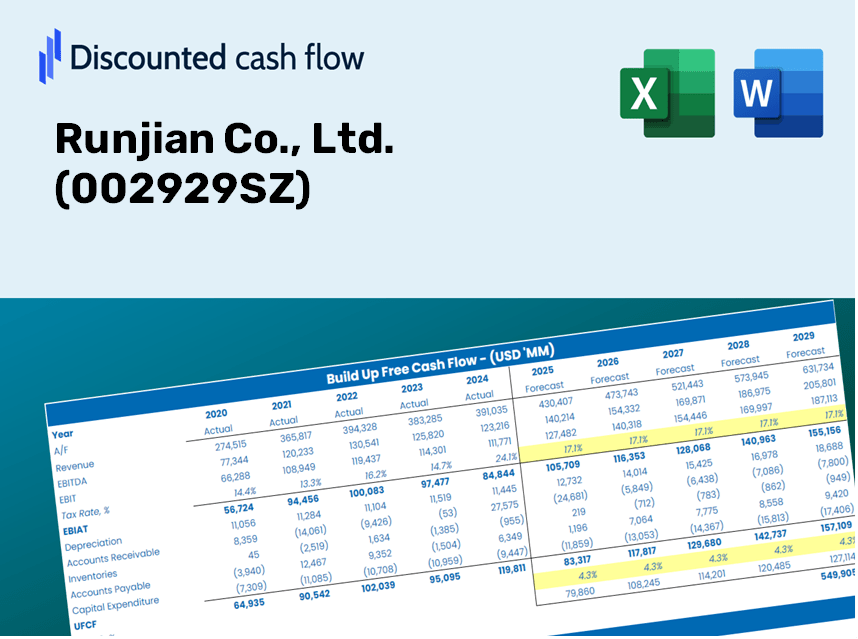
Runjian Co., Ltd. (002929.SZ) DCF Valuation |
Fully Editable: Tailor To Your Needs In Excel Or Sheets
Professional Design: Trusted, Industry-Standard Templates
Investor-Approved Valuation Models
MAC/PC Compatible, Fully Unlocked
No Expertise Is Needed; Easy To Follow
Runjian Co., Ltd. (002929.SZ) Bundle
Evaluate Runjian Co., Ltd.'s financial prospects with expert precision! This (002929SZ) DCF Calculator provides pre-filled financial data and total flexibility to modify revenue growth, WACC, margins, and other crucial assumptions based on your predictions.
Discounted Cash Flow (DCF) - (USD MM)
| Year | AY1 2020 |
AY2 2021 |
AY3 2022 |
AY4 2023 |
AY5 2024 |
FY1 2025 |
FY2 2026 |
FY3 2027 |
FY4 2028 |
FY5 2029 |
|---|---|---|---|---|---|---|---|---|---|---|
| Revenue | 4,192.6 | 6,602.3 | 8,159.3 | 8,825.8 | 9,198.7 | 11,347.8 | 13,998.9 | 17,269.5 | 21,304.1 | 26,281.3 |
| Revenue Growth, % | 0 | 57.47 | 23.58 | 8.17 | 4.23 | 23.36 | 23.36 | 23.36 | 23.36 | 23.36 |
| EBITDA | 244.5 | 433.7 | 578.6 | 570.2 | 411.0 | 690.4 | 851.7 | 1,050.7 | 1,296.2 | 1,599.0 |
| EBITDA, % | 5.83 | 6.57 | 7.09 | 6.46 | 4.47 | 6.08 | 6.08 | 6.08 | 6.08 | 6.08 |
| Depreciation | 29.6 | 30.7 | 33.3 | 48.4 | 86.9 | 69.7 | 86.0 | 106.1 | 130.8 | 161.4 |
| Depreciation, % | 0.70485 | 0.46487 | 0.40785 | 0.54793 | 0.945 | 0.6141 | 0.6141 | 0.6141 | 0.6141 | 0.6141 |
| EBIT | 214.9 | 403.0 | 545.3 | 521.9 | 324.1 | 620.7 | 765.7 | 944.6 | 1,165.3 | 1,437.6 |
| EBIT, % | 5.13 | 6.1 | 6.68 | 5.91 | 3.52 | 5.47 | 5.47 | 5.47 | 5.47 | 5.47 |
| Total Cash | 2,065.6 | 2,920.4 | 1,986.0 | 1,940.7 | 2,025.7 | 3,673.3 | 4,531.4 | 5,590.1 | 6,896.1 | 8,507.2 |
| Total Cash, percent | .0 | .0 | .0 | .0 | .0 | .0 | .0 | .0 | .0 | .0 |
| Account Receivables | 2,040.9 | 3,642.8 | 5,171.8 | 6,672.8 | 7,883.6 | 7,456.5 | 9,198.6 | 11,347.6 | 13,998.8 | 17,269.2 |
| Account Receivables, % | 48.68 | 55.17 | 63.38 | 75.61 | 85.7 | 65.71 | 65.71 | 65.71 | 65.71 | 65.71 |
| Inventories | 933.3 | 1,148.9 | 1,304.1 | 1,739.7 | 1,920.8 | 2,184.2 | 2,694.4 | 3,323.9 | 4,100.5 | 5,058.5 |
| Inventories, % | 22.26 | 17.4 | 15.98 | 19.71 | 20.88 | 19.25 | 19.25 | 19.25 | 19.25 | 19.25 |
| Accounts Payable | 1,898.0 | 3,395.1 | 4,691.0 | 5,686.8 | 6,902.5 | 6,664.7 | 8,221.8 | 10,142.6 | 12,512.2 | 15,435.4 |
| Accounts Payable, % | 45.27 | 51.42 | 57.49 | 64.43 | 75.04 | 58.73 | 58.73 | 58.73 | 58.73 | 58.73 |
| Capital Expenditure | -108.6 | -368.7 | -410.5 | -216.0 | -376.2 | -448.1 | -552.8 | -681.9 | -841.3 | -1,037.8 |
| Capital Expenditure, % | -2.59 | -5.59 | -5.03 | -2.45 | -4.09 | -3.95 | -3.95 | -3.95 | -3.95 | -3.95 |
| Tax Rate, % | -6.47 | -6.47 | -6.47 | -6.47 | -6.47 | -6.47 | -6.47 | -6.47 | -6.47 | -6.47 |
| EBITAT | 197.4 | 345.3 | 459.4 | 488.3 | 345.1 | 565.3 | 697.3 | 860.3 | 1,061.2 | 1,309.2 |
| Depreciation | ||||||||||
| Changes in Account Receivables | ||||||||||
| Changes in Inventories | ||||||||||
| Changes in Accounts Payable | ||||||||||
| Capital Expenditure | ||||||||||
| UFCF | -957.9 | -313.2 | -306.0 | -620.1 | -120.4 | 112.7 | -464.8 | -573.3 | -707.3 | -872.5 |
| WACC, % | 4.51 | 4.46 | 4.45 | 4.53 | 4.59 | 4.51 | 4.51 | 4.51 | 4.51 | 4.51 |
| PV UFCF | ||||||||||
| SUM PV UFCF | -2,112.8 | |||||||||
| Long Term Growth Rate, % | 3.50 | |||||||||
| Free cash flow (T + 1) | -903 | |||||||||
| Terminal Value | -89,603 | |||||||||
| Present Terminal Value | -71,875 | |||||||||
| Enterprise Value | -73,988 | |||||||||
| Net Debt | 870 | |||||||||
| Equity Value | -74,858 | |||||||||
| Diluted Shares Outstanding, MM | 277 | |||||||||
| Equity Value Per Share | -270.21 |
Benefits You Will Receive
- Comprehensive Financial Model: Runjian Co., Ltd.’s actual data facilitates accurate DCF valuation.
- Full Forecasting Flexibility: Modify revenue growth, profit margins, WACC, and other essential parameters.
- Real-Time Calculations: Instant updates allow you to view outcomes as you make adjustments.
- Professional-Grade Template: A polished Excel file tailored for sophisticated valuation needs.
- Customizable and Reusable: Designed for versatility, enabling frequent use for in-depth projections.
Key Features
- Customizable Forecast Settings: Adjust essential parameters such as revenue growth, EBITDA %, and capital investments.
- Instant DCF Valuation: Quickly computes intrinsic value, NPV, and additional metrics with ease.
- Precision of Professional-Grade Analysis: Utilizes Runjian Co., Ltd.'s real-world financial data for accurate valuation results.
- Simplified Scenario Analysis: Effortlessly test varying assumptions and assess different outcomes.
- Efficiency Booster: Remove the hassle of creating complex valuation models from the ground up.
How It Functions
- Download: Obtain the ready-to-use Excel file containing Runjian Co., Ltd.'s (002929SZ) financial data.
- Customize: Modify forecasts such as revenue growth, EBITDA percentage, and WACC.
- Update Automatically: Intrinsic value and NPV calculations refresh in real-time.
- Test Scenarios: Generate various projections and instantly compare the results.
- Make Decisions: Leverage the valuation findings to inform your investment strategy.
Reasons to Choose Our Calculator for Runjian Co., Ltd. (002929SZ)
- Designed for Experts: A sophisticated tool utilized by financial analysts, CFOs, and consultants.
- Accurate Data: Historical and forecasted financials for Runjian Co., Ltd. (002929SZ) preloaded for reliability.
- Scenario Analysis: Effortlessly model various forecasts and assumptions.
- Comprehensive Outputs: Instantly computes intrinsic value, NPV, and critical financial metrics.
- User-Friendly: Follow straightforward, step-by-step instructions throughout the calculation process.
Who Should Use Runjian Co., Ltd. (002929SZ)?
- Investors: Accurately assess the fair value of Runjian Co., Ltd. (002929SZ) before making investment choices.
- CFOs: Utilize a robust DCF model for financial analysis and reporting related to Runjian Co., Ltd. (002929SZ).
- Consultants: Easily customize the valuation template for client reports concerning Runjian Co., Ltd. (002929SZ).
- Entrepreneurs: Discover financial modeling practices employed by top corporations, including Runjian Co., Ltd. (002929SZ).
- Educators: Implement this tool in teaching to illustrate various valuation methods, including those applicable to Runjian Co., Ltd. (002929SZ).
Contents of the Runjian Co., Ltd. Template
- Preloaded Runjian Data: Historical and forecasted financial metrics, including revenue, EBIT, and capital expenditures.
- DCF and WACC Models: Advanced spreadsheets for calculating intrinsic value and the Weighted Average Cost of Capital.
- Customizable Inputs: Yellow-highlighted fields for modifying revenue growth, tax rates, and discount rates.
- Financial Statements: Detailed annual and quarterly financial reports for in-depth analysis.
- Key Ratios: Ratios for profitability, leverage, and efficiency to assess performance.
- Dashboard and Charts: Visual representations of valuation results and underlying assumptions.
Disclaimer
All information, articles, and product details provided on this website are for general informational and educational purposes only. We do not claim any ownership over, nor do we intend to infringe upon, any trademarks, copyrights, logos, brand names, or other intellectual property mentioned or depicted on this site. Such intellectual property remains the property of its respective owners, and any references here are made solely for identification or informational purposes, without implying any affiliation, endorsement, or partnership.
We make no representations or warranties, express or implied, regarding the accuracy, completeness, or suitability of any content or products presented. Nothing on this website should be construed as legal, tax, investment, financial, medical, or other professional advice. In addition, no part of this site—including articles or product references—constitutes a solicitation, recommendation, endorsement, advertisement, or offer to buy or sell any securities, franchises, or other financial instruments, particularly in jurisdictions where such activity would be unlawful.
All content is of a general nature and may not address the specific circumstances of any individual or entity. It is not a substitute for professional advice or services. Any actions you take based on the information provided here are strictly at your own risk. You accept full responsibility for any decisions or outcomes arising from your use of this website and agree to release us from any liability in connection with your use of, or reliance upon, the content or products found herein.