
|
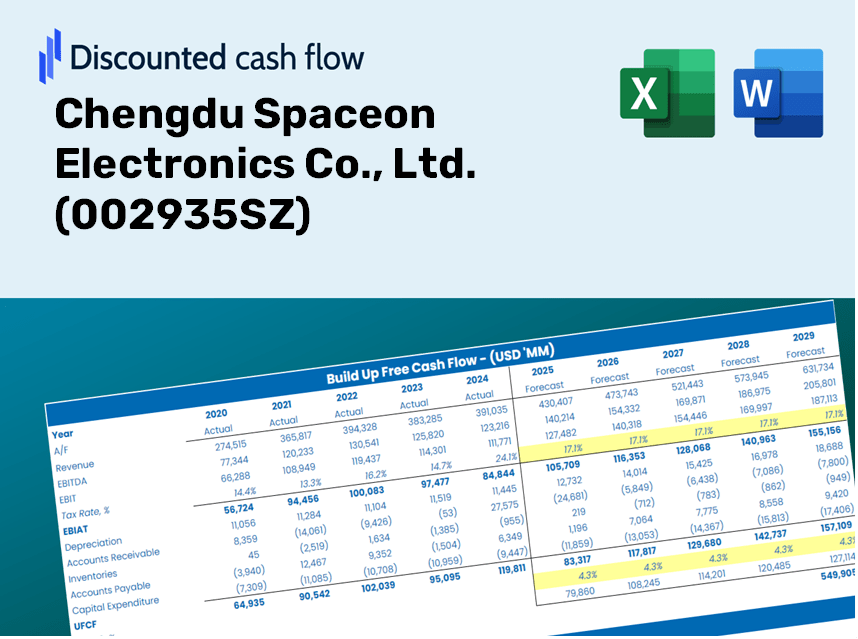
Chengdu Spaceon Electronics Co., Ltd. (002935.SZ) DCF Valuation |
Fully Editable: Tailor To Your Needs In Excel Or Sheets
Professional Design: Trusted, Industry-Standard Templates
Investor-Approved Valuation Models
MAC/PC Compatible, Fully Unlocked
No Expertise Is Needed; Easy To Follow
Chengdu Spaceon Electronics Co., Ltd. (002935.SZ) Bundle
Explore the financial outlook of Chengdu Spaceon Electronics Co., Ltd. (002935SZ) with our user-friendly DCF Calculator! Enter your projections for growth, margins, and expenses to calculate the intrinsic value of Chengdu Spaceon Electronics Co., Ltd. (002935SZ) and inform your investment approach.
Discounted Cash Flow (DCF) - (USD MM)
| Year | AY1 2020 |
AY2 2021 |
AY3 2022 |
AY4 2023 |
AY5 2024 |
FY1 2025 |
FY2 2026 |
FY3 2027 |
FY4 2028 |
FY5 2029 |
|---|---|---|---|---|---|---|---|---|---|---|
| Revenue | 916.4 | 1,042.9 | 1,210.9 | 1,108.9 | 964.4 | 984.8 | 1,005.6 | 1,026.8 | 1,048.5 | 1,070.7 |
| Revenue Growth, % | 0 | 13.81 | 16.1 | -8.42 | -13.04 | 2.11 | 2.11 | 2.11 | 2.11 | 2.11 |
| EBITDA | 119.5 | 138.1 | 135.4 | 115.8 | 91.9 | 113.1 | 115.5 | 118.0 | 120.5 | 123.0 |
| EBITDA, % | 13.05 | 13.24 | 11.18 | 10.44 | 9.53 | 11.49 | 11.49 | 11.49 | 11.49 | 11.49 |
| Depreciation | 9.3 | 11.8 | 18.2 | 22.5 | 23.5 | 16.0 | 16.3 | 16.7 | 17.0 | 17.4 |
| Depreciation, % | 1.02 | 1.13 | 1.5 | 2.03 | 2.43 | 1.62 | 1.62 | 1.62 | 1.62 | 1.62 |
| EBIT | 110.2 | 126.3 | 117.2 | 93.3 | 68.5 | 97.1 | 99.2 | 101.3 | 103.4 | 105.6 |
| EBIT, % | 12.03 | 12.11 | 9.68 | 8.41 | 7.1 | 9.87 | 9.87 | 9.87 | 9.87 | 9.87 |
| Total Cash | 383.9 | 411.3 | 787.5 | 455.8 | 484.2 | 468.1 | 478.0 | 488.1 | 498.4 | 509.0 |
| Total Cash, percent | .0 | .0 | .0 | .0 | .0 | .0 | .0 | .0 | .0 | .0 |
| Account Receivables | 560.5 | 642.6 | 850.8 | 1,173.4 | 1,291.7 | 774.1 | 790.5 | 807.2 | 824.2 | 841.7 |
| Account Receivables, % | 61.16 | 61.62 | 70.26 | 105.81 | 133.94 | 78.61 | 78.61 | 78.61 | 78.61 | 78.61 |
| Inventories | 470.6 | 492.9 | 583.3 | 599.3 | 753.8 | 549.5 | 561.1 | 572.9 | 585.0 | 597.4 |
| Inventories, % | 51.35 | 47.26 | 48.17 | 54.04 | 78.16 | 55.8 | 55.8 | 55.8 | 55.8 | 55.8 |
| Accounts Payable | 381.3 | 430.8 | 821.7 | 850.8 | 758.1 | 602.9 | 615.6 | 628.6 | 641.9 | 655.5 |
| Accounts Payable, % | 41.61 | 41.31 | 67.86 | 76.72 | 78.61 | 61.22 | 61.22 | 61.22 | 61.22 | 61.22 |
| Capital Expenditure | -59.6 | -86.0 | -27.0 | -58.2 | -23.3 | -48.5 | -49.6 | -50.6 | -51.7 | -52.8 |
| Capital Expenditure, % | -6.51 | -8.25 | -2.23 | -5.25 | -2.42 | -4.93 | -4.93 | -4.93 | -4.93 | -4.93 |
| Tax Rate, % | 6.01 | 6.01 | 6.01 | 6.01 | 6.01 | 6.01 | 6.01 | 6.01 | 6.01 | 6.01 |
| EBITAT | 102.0 | 119.2 | 112.8 | 87.8 | 64.3 | 91.6 | 93.5 | 95.5 | 97.5 | 99.6 |
| Depreciation | ||||||||||
| Changes in Account Receivables | ||||||||||
| Changes in Inventories | ||||||||||
| Changes in Accounts Payable | ||||||||||
| Capital Expenditure | ||||||||||
| UFCF | -598.1 | -9.9 | 196.3 | -257.4 | -301.0 | 625.7 | 45.0 | 46.0 | 46.9 | 47.9 |
| WACC, % | 5.77 | 5.77 | 5.78 | 5.77 | 5.77 | 5.77 | 5.77 | 5.77 | 5.77 | 5.77 |
| PV UFCF | ||||||||||
| SUM PV UFCF | 744.3 | |||||||||
| Long Term Growth Rate, % | 4.00 | |||||||||
| Free cash flow (T + 1) | 50 | |||||||||
| Terminal Value | 2,810 | |||||||||
| Present Terminal Value | 2,122 | |||||||||
| Enterprise Value | 2,867 | |||||||||
| Net Debt | -484 | |||||||||
| Equity Value | 3,351 | |||||||||
| Diluted Shares Outstanding, MM | 425 | |||||||||
| Equity Value Per Share | 7.89 |
What You Will Receive
- Edit-Friendly Forecast Inputs: Effortlessly adjust key assumptions (growth %, margins, WACC) to explore various scenarios.
- Comprehensive Real-World Data: Pre-loaded financial information for Chengdu Spaceon Electronics Co., Ltd. (002935SZ) to kickstart your analysis.
- Automated DCF Outputs: The model computes Net Present Value (NPV) and intrinsic value automatically for your convenience.
- Professional and Customizable: A sleek Excel template that tailors to your valuation requirements.
- Designed for Analysts and Investors: Perfect for assessing projections, validating strategies, and enhancing efficiency.
Key Features
- Comprehensive Data Availability: Access to Chengdu Spaceon Electronics' historical financial statements and ready-made forecasts.
- Customizable Parameters: Adjust WACC, tax rates, revenue growth, and EBITDA margins to fit your analysis.
- Real-Time Analytics: Monitor the intrinsic value of Chengdu Spaceon Electronics ([002935SZ]) as it updates instantly.
- Intuitive Visual Dashboards: Engaging charts that present valuation outcomes and key performance indicators clearly.
- Precision-Engineered Tools: Designed for analysts, investors, and finance professionals aiming for accuracy.
How It Works
- Step 1: Download the prebuilt Excel template featuring Chengdu Spaceon Electronics Co., Ltd.'s (002935SZ) data.
- Step 2: Navigate through the pre-filled sheets to familiarize yourself with the key performance indicators.
- Step 3: Modify the forecasts and assumptions in the editable yellow cells (WACC, growth, margins).
- Step 4: Instantly observe the recalculated outcomes, including the intrinsic value of Chengdu Spaceon Electronics Co., Ltd. (002935SZ).
- Step 5: Utilize the results to make informed investment choices or create detailed reports.
Why Opt for This Calculator?
- All-in-One Solution: Combines DCF, WACC, and financial ratio analyses for comprehensive evaluations.
- Adjustable Parameters: Modify the yellow-highlighted cells to explore different scenarios.
- In-Depth Analysis: Automatically computes the intrinsic value and Net Present Value for Chengdu Spaceon Electronics Co., Ltd. (002935SZ).
- Preloaded Information: Includes historical and projected data for reliable baseline assessments.
- High-Caliber Tool: Perfect for financial analysts, investors, and business consultants alike.
Who Can Benefit from Chengdu Spaceon Electronics Co., Ltd. (002935SZ)?
- Electronics Students: Discover key industry insights and apply theoretical knowledge to real-world scenarios.
- Researchers: Utilize advanced models for inclusion in academic projects or studies.
- Investors: Evaluate your own investment strategies and assess the performance metrics of Chengdu Spaceon Electronics.
- Market Analysts: Enhance your analysis process with a tailored, easy-to-use financial model specific to the electronics sector.
- Entrepreneurs: Understand how large electronics firms like Chengdu Spaceon are assessed in the market.
Contents of the Template
- Historical Data: Contains past financials and baseline forecasts for Chengdu Spaceon Electronics Co., Ltd. (002935SZ).
- DCF and Levered DCF Models: Comprehensive templates designed to calculate the intrinsic value of Chengdu Spaceon Electronics Co., Ltd. (002935SZ).
- WACC Sheet: Pre-calculated figures for the Weighted Average Cost of Capital.
- Editable Inputs: Customize key metrics such as growth rates, EBITDA %, and CAPEX assumptions.
- Quarterly and Annual Statements: A thorough overview of Chengdu Spaceon Electronics Co., Ltd. (002935SZ)'s financials.
- Interactive Dashboard: Dynamically visualize valuation results and projections.
Disclaimer
All information, articles, and product details provided on this website are for general informational and educational purposes only. We do not claim any ownership over, nor do we intend to infringe upon, any trademarks, copyrights, logos, brand names, or other intellectual property mentioned or depicted on this site. Such intellectual property remains the property of its respective owners, and any references here are made solely for identification or informational purposes, without implying any affiliation, endorsement, or partnership.
We make no representations or warranties, express or implied, regarding the accuracy, completeness, or suitability of any content or products presented. Nothing on this website should be construed as legal, tax, investment, financial, medical, or other professional advice. In addition, no part of this site—including articles or product references—constitutes a solicitation, recommendation, endorsement, advertisement, or offer to buy or sell any securities, franchises, or other financial instruments, particularly in jurisdictions where such activity would be unlawful.
All content is of a general nature and may not address the specific circumstances of any individual or entity. It is not a substitute for professional advice or services. Any actions you take based on the information provided here are strictly at your own risk. You accept full responsibility for any decisions or outcomes arising from your use of this website and agree to release us from any liability in connection with your use of, or reliance upon, the content or products found herein.