
|
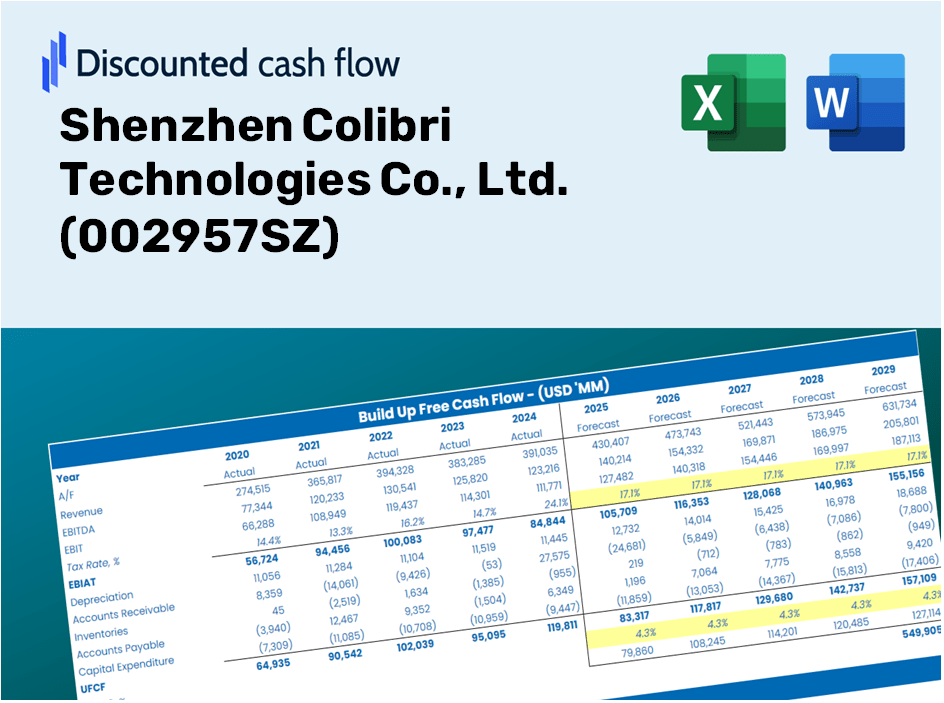
Shenzhen Colibri Technologies Co., Ltd. (002957.SZ) DCF Valuation |
Fully Editable: Tailor To Your Needs In Excel Or Sheets
Professional Design: Trusted, Industry-Standard Templates
Investor-Approved Valuation Models
MAC/PC Compatible, Fully Unlocked
No Expertise Is Needed; Easy To Follow
Shenzhen Colibri Technologies Co., Ltd. (002957.SZ) Bundle
Simplify Shenzhen Colibri Technologies Co., Ltd. (002957SZ) valuation with this customizable DCF Calculator! Featuring real Shenzhen Colibri Technologies Co., Ltd. (002957SZ) financials and adjustable forecast inputs, you can test scenarios and uncover Shenzhen Colibri Technologies Co., Ltd. (002957SZ) fair value in minutes.
Discounted Cash Flow (DCF) - (USD MM)
| Year | AY1 2020 |
AY2 2021 |
AY3 2022 |
AY4 2023 |
AY5 2024 |
FY1 2025 |
FY2 2026 |
FY3 2027 |
FY4 2028 |
FY5 2029 |
|---|---|---|---|---|---|---|---|---|---|---|
| Revenue | 2,014.3 | 2,161.2 | 3,246.2 | 2,857.4 | 2,447.7 | 2,638.5 | 2,844.2 | 3,065.9 | 3,304.8 | 3,562.4 |
| Revenue Growth, % | 0 | 7.29 | 50.2 | -11.98 | -14.34 | 7.79 | 7.79 | 7.79 | 7.79 | 7.79 |
| EBITDA | 354.8 | 96.1 | 416.9 | 223.1 | 257.5 | 280.9 | 302.8 | 326.4 | 351.8 | 379.3 |
| EBITDA, % | 17.61 | 4.45 | 12.84 | 7.81 | 10.52 | 10.65 | 10.65 | 10.65 | 10.65 | 10.65 |
| Depreciation | 38.1 | 40.1 | 46.7 | 54.6 | 61.1 | 50.6 | 54.6 | 58.8 | 63.4 | 68.3 |
| Depreciation, % | 1.89 | 1.86 | 1.44 | 1.91 | 2.49 | 1.92 | 1.92 | 1.92 | 1.92 | 1.92 |
| EBIT | 316.7 | 56.0 | 370.1 | 168.5 | 196.4 | 230.3 | 248.2 | 267.6 | 288.4 | 310.9 |
| EBIT, % | 15.72 | 2.59 | 11.4 | 5.9 | 8.03 | 8.73 | 8.73 | 8.73 | 8.73 | 8.73 |
| Total Cash | 1,233.3 | 1,038.5 | 912.1 | 802.6 | 527.7 | 986.9 | 1,063.8 | 1,146.8 | 1,236.2 | 1,332.5 |
| Total Cash, percent | .0 | .0 | .0 | .0 | .0 | .0 | .0 | .0 | .0 | .0 |
| Account Receivables | 1,030.7 | 1,237.6 | 2,013.2 | 1,904.5 | 1,658.4 | 1,608.7 | 1,734.1 | 1,869.3 | 2,015.0 | 2,172.0 |
| Account Receivables, % | 51.17 | 57.26 | 62.02 | 66.65 | 67.75 | 60.97 | 60.97 | 60.97 | 60.97 | 60.97 |
| Inventories | 359.2 | 1,049.5 | 1,438.4 | 1,231.7 | 1,092.1 | 1,047.1 | 1,128.7 | 1,216.7 | 1,311.5 | 1,413.8 |
| Inventories, % | 17.83 | 48.56 | 44.31 | 43.11 | 44.62 | 39.69 | 39.69 | 39.69 | 39.69 | 39.69 |
| Accounts Payable | 487.3 | 923.2 | 1,288.8 | 598.1 | 866.4 | 859.8 | 926.8 | 999.1 | 1,077.0 | 1,160.9 |
| Accounts Payable, % | 24.19 | 42.72 | 39.7 | 20.93 | 35.39 | 32.59 | 32.59 | 32.59 | 32.59 | 32.59 |
| Capital Expenditure | -70.9 | -182.9 | -352.7 | -188.6 | -175.4 | -193.2 | -208.3 | -224.5 | -242.0 | -260.9 |
| Capital Expenditure, % | -3.52 | -8.46 | -10.86 | -6.6 | -7.17 | -7.32 | -7.32 | -7.32 | -7.32 | -7.32 |
| Tax Rate, % | 31.46 | 31.46 | 31.46 | 31.46 | 31.46 | 31.46 | 31.46 | 31.46 | 31.46 | 31.46 |
| EBITAT | 253.7 | 18.9 | 268.3 | 115.4 | 134.6 | 148.9 | 160.5 | 173.0 | 186.5 | 201.0 |
| Depreciation | ||||||||||
| Changes in Account Receivables | ||||||||||
| Changes in Inventories | ||||||||||
| Changes in Accounts Payable | ||||||||||
| Capital Expenditure | ||||||||||
| UFCF | -681.7 | -585.2 | -836.6 | -393.8 | 674.2 | 94.5 | -133.2 | -143.6 | -154.8 | -166.8 |
| WACC, % | 6.12 | 6.01 | 6.1 | 6.09 | 6.09 | 6.08 | 6.08 | 6.08 | 6.08 | 6.08 |
| PV UFCF | ||||||||||
| SUM PV UFCF | -395.9 | |||||||||
| Long Term Growth Rate, % | 3.50 | |||||||||
| Free cash flow (T + 1) | -173 | |||||||||
| Terminal Value | -6,683 | |||||||||
| Present Terminal Value | -4,974 | |||||||||
| Enterprise Value | -5,370 | |||||||||
| Net Debt | -53 | |||||||||
| Equity Value | -5,317 | |||||||||
| Diluted Shares Outstanding, MM | 410 | |||||||||
| Equity Value Per Share | -12.96 |
What You Will Receive
- Authentic Shenzhen Colibri Data: Preloaded financial metrics – from revenue to EBIT – based on real and projected figures.
- Comprehensive Customization: Modify all essential parameters (yellow cells) such as WACC, growth %, and tax rates.
- Immediate Valuation Updates: Automatic recalculations to assess the impact of changes on Shenzhen Colibri's fair value.
- Flexible Excel Template: Designed for quick adjustments, scenario analysis, and in-depth projections.
- Efficient and Precise: Eliminate the need to build models from scratch while ensuring accuracy and adaptability.
Core Highlights
- Authentic Shenzhen Colibri Data: Gain access to reliable pre-loaded historical records and future forecasts.
- Adjustable Projection Assumptions: Modify the yellow-highlighted fields such as WACC, growth rates, and profit margins.
- Real-Time Calculations: Automatic adjustments to DCF, Net Present Value (NPV), and cash flow evaluations.
- Interactive Dashboard: Clear and concise charts and summaries to help you visualize your valuation findings.
- Suitable for All Experience Levels: A user-friendly layout designed for investors, CFOs, and consultants alike.
How It Operates
- Download the Template: Gain immediate access to the Excel-based Shenzhen Colibri Technologies DCF Calculator.
- Enter Your Assumptions: Modify the yellow-highlighted cells for growth rates, WACC, profit margins, and other factors.
- Instant Calculations: The model automatically refreshes the intrinsic value of Shenzhen Colibri Technologies (002957SZ).
- Explore Scenarios: Test various assumptions to assess potential changes in valuation.
- Analyze and Conclude: Leverage the findings to inform your investment or financial decisions.
Why Opt for Our Calculator?
- All-In-One Solution: Features DCF, WACC, and various financial ratio analyses in a single interface.
- Flexible Inputs: Modify the highlighted fields to explore different financial scenarios.
- Comprehensive Analysis: Automatically computes the intrinsic value and Net Present Value of Shenzhen Colibri Technologies Co., Ltd. (002957SZ).
- Data-Driven Insights: Comes with historical and projected data for precise calculations.
- High-Quality Standards: Perfect for financial experts, investors, and business advisors.
Who Can Benefit from This Product?
- Individual Investors: Make well-informed decisions regarding the purchase or sale of Shenzhen Colibri Technologies Co., Ltd. (002957SZ) shares.
- Financial Analysts: Enhance valuation workflows with ready-to-implement financial models tailored for Shenzhen Colibri Technologies Co., Ltd. (002957SZ).
- Consultants: Provide clients with prompt and precise valuation insights relating to Shenzhen Colibri Technologies Co., Ltd. (002957SZ).
- Business Owners: Gain insights into the valuation of established companies like Shenzhen Colibri Technologies Co., Ltd. (002957SZ) to inform your own business strategies.
- Finance Students: Master valuation methodologies using real-world data and scenarios related to Shenzhen Colibri Technologies Co., Ltd. (002957SZ).
Contents of the Template
- Preloaded 002957SZ Data: Historical and projected financial metrics, including revenue, EBIT, and capital expenditures.
- DCF and WACC Models: Advanced spreadsheets for determining intrinsic value and Weighted Average Cost of Capital.
- Editable Inputs: Cells highlighted in yellow for customizing revenue growth, tax rates, and discount rates.
- Financial Statements: Detailed annual and quarterly financial reports for in-depth analysis.
- Key Ratios: Metrics on profitability, leverage, and efficiency for performance evaluation.
- Dashboard and Charts: Visual representations of valuation results and underlying assumptions.
Disclaimer
All information, articles, and product details provided on this website are for general informational and educational purposes only. We do not claim any ownership over, nor do we intend to infringe upon, any trademarks, copyrights, logos, brand names, or other intellectual property mentioned or depicted on this site. Such intellectual property remains the property of its respective owners, and any references here are made solely for identification or informational purposes, without implying any affiliation, endorsement, or partnership.
We make no representations or warranties, express or implied, regarding the accuracy, completeness, or suitability of any content or products presented. Nothing on this website should be construed as legal, tax, investment, financial, medical, or other professional advice. In addition, no part of this site—including articles or product references—constitutes a solicitation, recommendation, endorsement, advertisement, or offer to buy or sell any securities, franchises, or other financial instruments, particularly in jurisdictions where such activity would be unlawful.
All content is of a general nature and may not address the specific circumstances of any individual or entity. It is not a substitute for professional advice or services. Any actions you take based on the information provided here are strictly at your own risk. You accept full responsibility for any decisions or outcomes arising from your use of this website and agree to release us from any liability in connection with your use of, or reliance upon, the content or products found herein.