
|
Shenzhen Baoming Technology Co.,Ltd. (002992.SZ) DCF Valuation |
Fully Editable: Tailor To Your Needs In Excel Or Sheets
Professional Design: Trusted, Industry-Standard Templates
Investor-Approved Valuation Models
MAC/PC Compatible, Fully Unlocked
No Expertise Is Needed; Easy To Follow
Shenzhen Baoming Technology Co.,Ltd. (002992.SZ) Bundle
Whether you’re an investor or analyst, this [Symbol] DCF Calculator is your essential resource for accurate valuation. Featuring real data from Shenzhen Baoming Technology Co., Ltd., you can adjust forecasts and observe the effects in real time.
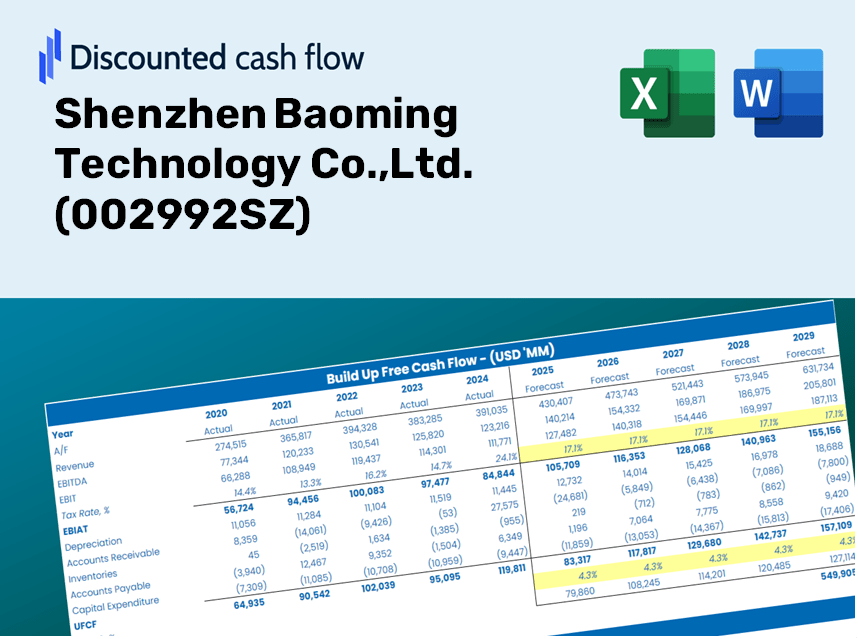
Discounted Cash Flow (DCF) - (USD MM)
| Year | AY1 2020 |
AY2 2021 |
AY3 2022 |
AY4 2023 |
AY5 2024 |
FY1 2025 |
FY2 2026 |
FY3 2027 |
FY4 2028 |
FY5 2029 |
|---|---|---|---|---|---|---|---|---|---|---|
| Revenue | 1,378.4 | 1,115.4 | 939.8 | 1,320.6 | 1,523.2 | 1,603.4 | 1,687.7 | 1,776.5 | 1,869.9 | 1,968.3 |
| Revenue Growth, % | 0 | -19.08 | -15.74 | 40.52 | 15.34 | 5.26 | 5.26 | 5.26 | 5.26 | 5.26 |
| EBITDA | 85.1 | -170.9 | -45.3 | -.4 | 49.1 | -34.5 | -36.4 | -38.3 | -40.3 | -42.4 |
| EBITDA, % | 6.17 | -15.32 | -4.82 | -0.02757003 | 3.22 | -2.15 | -2.15 | -2.15 | -2.15 | -2.15 |
| Depreciation | 73.3 | 95.5 | 102.1 | 90.8 | 99.7 | 122.4 | 128.8 | 135.6 | 142.7 | 150.3 |
| Depreciation, % | 5.32 | 8.56 | 10.87 | 6.88 | 6.55 | 7.63 | 7.63 | 7.63 | 7.63 | 7.63 |
| EBIT | 11.8 | -266.3 | -147.4 | -91.2 | -50.6 | -156.9 | -165.2 | -173.9 | -183.0 | -192.7 |
| EBIT, % | 0.85394 | -23.88 | -15.69 | -6.91 | -3.32 | -9.79 | -9.79 | -9.79 | -9.79 | -9.79 |
| Total Cash | 759.6 | 529.9 | 289.5 | 295.5 | 235.8 | 549.2 | 578.1 | 608.6 | 640.6 | 674.3 |
| Total Cash, percent | .0 | .0 | .0 | .0 | .0 | .0 | .0 | .0 | .0 | .0 |
| Account Receivables | 802.1 | 631.6 | 511.2 | 782.8 | 671.7 | 874.1 | 920.1 | 968.5 | 1,019.4 | 1,073.0 |
| Account Receivables, % | 58.19 | 56.63 | 54.39 | 59.27 | 44.1 | 54.52 | 54.52 | 54.52 | 54.52 | 54.52 |
| Inventories | 138.1 | 79.5 | 73.5 | 120.1 | 77.1 | 125.5 | 132.1 | 139.0 | 146.3 | 154.0 |
| Inventories, % | 10.02 | 7.13 | 7.82 | 9.09 | 5.06 | 7.83 | 7.83 | 7.83 | 7.83 | 7.83 |
| Accounts Payable | 680.1 | 654.2 | 480.0 | 804.0 | 651.9 | 842.5 | 886.8 | 933.5 | 982.6 | 1,034.3 |
| Accounts Payable, % | 49.34 | 58.65 | 51.07 | 60.88 | 42.79 | 52.55 | 52.55 | 52.55 | 52.55 | 52.55 |
| Capital Expenditure | -288.9 | -353.2 | -210.1 | -93.8 | -121.6 | -288.8 | -304.0 | -320.0 | -336.9 | -354.6 |
| Capital Expenditure, % | -20.96 | -31.67 | -22.36 | -7.1 | -7.98 | -18.02 | -18.02 | -18.02 | -18.02 | -18.02 |
| Tax Rate, % | 9.78 | 9.78 | 9.78 | 9.78 | 9.78 | 9.78 | 9.78 | 9.78 | 9.78 | 9.78 |
| EBITAT | 14.0 | -278.1 | -154.4 | -87.4 | -45.7 | -152.6 | -160.6 | -169.0 | -177.9 | -187.3 |
| Depreciation | ||||||||||
| Changes in Account Receivables | ||||||||||
| Changes in Inventories | ||||||||||
| Changes in Accounts Payable | ||||||||||
| Capital Expenditure | ||||||||||
| UFCF | -461.7 | -332.7 | -310.1 | -84.5 | -65.7 | -379.1 | -344.0 | -362.1 | -381.2 | -401.2 |
| WACC, % | 5.36 | 5.36 | 5.36 | 5.35 | 5.33 | 5.35 | 5.35 | 5.35 | 5.35 | 5.35 |
| PV UFCF | ||||||||||
| SUM PV UFCF | -1,598.2 | |||||||||
| Long Term Growth Rate, % | 2.00 | |||||||||
| Free cash flow (T + 1) | -409 | |||||||||
| Terminal Value | -12,214 | |||||||||
| Present Terminal Value | -9,412 | |||||||||
| Enterprise Value | -11,010 | |||||||||
| Net Debt | 255 | |||||||||
| Equity Value | -11,264 | |||||||||
| Diluted Shares Outstanding, MM | 178 | |||||||||
| Equity Value Per Share | -63.44 |
Benefits You Will Receive
- Customizable Forecast Inputs: Effortlessly adjust key variables (growth %, margins, WACC) to explore various scenarios.
- Real-World Financial Data: Shenzhen Baoming Technology Co., Ltd.’s (002992SZ) financial figures pre-loaded to facilitate your analysis.
- Automated DCF Calculations: The template computes Net Present Value (NPV) and intrinsic value automatically.
- Professional and Flexible Design: A sleek Excel model tailored to meet your valuation requirements.
- Designed for Analysts and Investors: Perfect for testing forecasts, validating strategies, and enhancing efficiency.
Key Features
- Customizable Forecast Inputs: Adjust essential metrics such as revenue growth, EBITDA margin, and capital expenditures effortlessly.
- Instant DCF Valuation: Automatically computes intrinsic value, NPV, and other financial metrics on the fly.
- High-Precision Results: Leverages Shenzhen Baoming Technology's (002992SZ) actual financial data to deliver accurate valuation insights.
- Simplified Scenario Analysis: Evaluate various assumptions and easily compare results across different scenarios.
- Efficiency Booster: Streamlines the valuation process, removing the necessity to construct complex financial models from scratch.
How It Functions
- Download: Obtain the pre-prepared Excel spreadsheet featuring Shenzhen Baoming Technology Co., Ltd.'s (002992SZ) financial information.
- Customize: Modify projections such as revenue growth, EBITDA margin, and weighted average cost of capital (WACC).
- Real-Time Updates: The intrinsic value and NPV calculations refresh automatically.
- Scenario Testing: Generate various forecasts and swiftly analyze the results.
- Make Informed Decisions: Leverage the valuation findings to shape your investment approach.
Why Choose This Calculator for Shenzhen Baoming Technology Co., Ltd. (002992SZ)?
- Designed for Experts: A sophisticated tool favored by financial analysts, CFOs, and industry consultants.
- Comprehensive Data: Historical and projected financial information for Shenzhen Baoming preloaded to ensure precision.
- Flexible Scenario Analysis: Effortlessly simulate various forecasts and assumptions.
- Insightful Outputs: Automatically computes intrinsic value, NPV, and essential financial metrics.
- User-Friendly: Step-by-step guidance to help you navigate the calculator with ease.
Who Should Utilize This Product?
- Investors: Accurately assess Shenzhen Baoming Technology Co., Ltd.'s (002992SZ) fair value prior to making investment choices.
- CFOs: Utilize a top-tier DCF model for financial analysis and reporting.
- Consultants: Effortlessly modify the template for client valuation reports.
- Entrepreneurs: Acquire insights into the financial modeling practices of leading companies.
- Educators: Employ it as a pedagogical tool to illustrate various valuation methodologies.
Contents of the Template
- Preloaded SZBT Data: Historical and forecasted financial data, including revenue, EBIT, and capital expenditures.
- DCF and WACC Models: Advanced spreadsheets for calculating intrinsic value and Weighted Average Cost of Capital.
- Editable Inputs: Yellow-highlighted cells for inputting revenue growth, tax rates, and discount rates.
- Financial Statements: Detailed annual and quarterly financial statements for thorough analysis.
- Key Ratios: Ratios for profitability, leverage, and efficiency to assess performance.
- Dashboard and Charts: Visual representations of valuation results and underlying assumptions.
Disclaimer
All information, articles, and product details provided on this website are for general informational and educational purposes only. We do not claim any ownership over, nor do we intend to infringe upon, any trademarks, copyrights, logos, brand names, or other intellectual property mentioned or depicted on this site. Such intellectual property remains the property of its respective owners, and any references here are made solely for identification or informational purposes, without implying any affiliation, endorsement, or partnership.
We make no representations or warranties, express or implied, regarding the accuracy, completeness, or suitability of any content or products presented. Nothing on this website should be construed as legal, tax, investment, financial, medical, or other professional advice. In addition, no part of this site—including articles or product references—constitutes a solicitation, recommendation, endorsement, advertisement, or offer to buy or sell any securities, franchises, or other financial instruments, particularly in jurisdictions where such activity would be unlawful.
All content is of a general nature and may not address the specific circumstances of any individual or entity. It is not a substitute for professional advice or services. Any actions you take based on the information provided here are strictly at your own risk. You accept full responsibility for any decisions or outcomes arising from your use of this website and agree to release us from any liability in connection with your use of, or reliance upon, the content or products found herein.