
|
China Ruyi Holdings Limited (0136.HK) DCF Valuation |
Fully Editable: Tailor To Your Needs In Excel Or Sheets
Professional Design: Trusted, Industry-Standard Templates
Investor-Approved Valuation Models
MAC/PC Compatible, Fully Unlocked
No Expertise Is Needed; Easy To Follow
China Ruyi Holdings Limited (0136.HK) Bundle
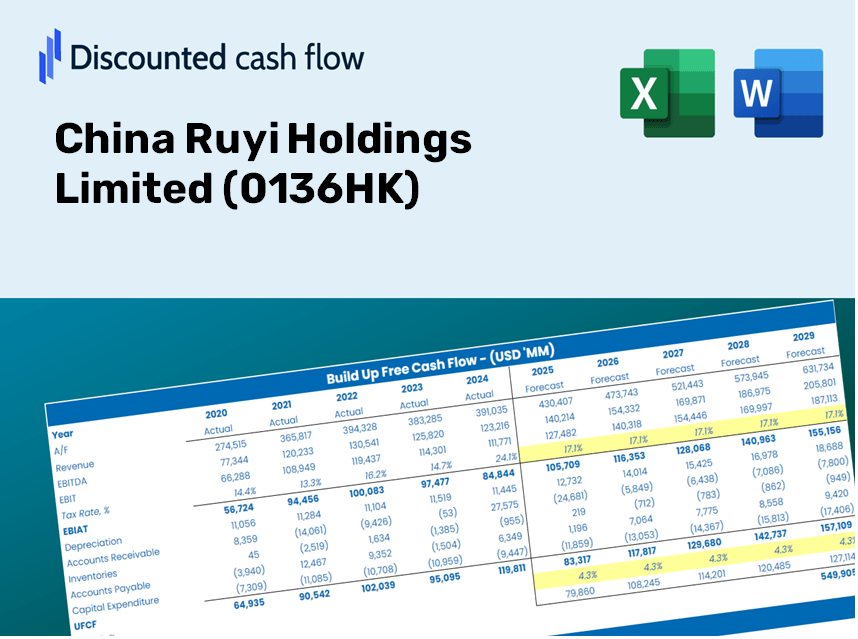
Discover the true value of China Ruyi Holdings Limited (0136HK) with our professional-grade DCF Calculator! Adjust key assumptions, explore multiple scenarios, and evaluate how changes affect the valuation of China Ruyi Holdings Limited (0136HK) – all within a single Excel template.
What You Will Receive
- Authentic China Ruyi Data: Preloaded financial information – encompassing revenue to EBIT – based on actual and forecasted metrics.
- Complete Customization: Modify all essential variables (yellow cells) such as WACC, growth %, and tax rates.
- Immediate Valuation Adjustments: Automatic recalculations to assess the effects of changes on China Ruyi's fair value.
- Flexible Excel Template: Designed for easy editing, scenario analysis, and comprehensive projections.
- Efficient and Reliable: Eliminate the need to build models from the ground up while ensuring accuracy and adaptability.
Key Features
- Real-Life 0136HK Data: Pre-filled with China Ruyi Holdings Limited's historical financials and future projections.
- Fully Customizable Inputs: Tailor revenue growth, margins, WACC, tax rates, and capital expenditures to your needs.
- Dynamic Valuation Model: Automatically updates Net Present Value (NPV) and intrinsic value based on your personalized inputs.
- Scenario Testing: Develop various forecast scenarios to examine different valuation outcomes.
- User-Friendly Design: Intuitive and structured layout suitable for both professionals and newcomers.
How It Functions
- Step 1: Download the Excel spreadsheet.
- Step 2: Examine the pre-filled data for China Ruyi Holdings Limited (0136HK) (historical and projected).
- Step 3: Modify key assumptions (highlighted in yellow) according to your assessment.
- Step 4: Observe real-time recalculations of China Ruyi Holdings Limited’s (0136HK) intrinsic value.
- Step 5: Utilize the results for your investment analysis or reporting needs.
Reasons to Use the China Ruyi Holdings Limited (0136HK) Calculator
- Time-Efficient: Skip the hassle of building a DCF model from the ground up – it's immediately available for use.
- Enhanced Accuracy: Dependable financial data and formulas minimize valuation errors.
- Completely Customizable: Adjust the model to align with your specific assumptions and forecasts.
- User-Friendly: Intuitive charts and outputs facilitate straightforward analysis of the results.
- Preferred by Professionals: Crafted for experts who prioritize both precision and functionality.
Who Can Benefit from This Product?
- Investors: Assess China Ruyi Holdings Limited’s (0136HK) valuation prior to making stock transactions.
- CFOs and Financial Analysts: Optimize valuation workflows and evaluate financial forecasts for accuracy.
- Startup Founders: Gain insights into how large public companies like China Ruyi Holdings Limited (0136HK) are appraised.
- Consultants: Provide comprehensive valuation reports to enhance client services.
- Students and Educators: Utilize authentic data to practice and impart valuation methodologies.
Contents of the Template
- Pre-Filled Data: Contains China Ruyi Holdings Limited’s historical financial information and projections.
- Discounted Cash Flow Model: An editable DCF valuation model with built-in automated calculations.
- Weighted Average Cost of Capital (WACC): A specific sheet for computing WACC based on your custom inputs.
- Key Financial Ratios: Evaluate China Ruyi Holdings Limited’s profitability, efficiency, and financial leverage.
- Customizable Inputs: Easily modify revenue growth rates, profit margins, and tax rates.
- Clear Dashboard: Visualizations and tables that summarize essential valuation outcomes.
Disclaimer
All information, articles, and product details provided on this website are for general informational and educational purposes only. We do not claim any ownership over, nor do we intend to infringe upon, any trademarks, copyrights, logos, brand names, or other intellectual property mentioned or depicted on this site. Such intellectual property remains the property of its respective owners, and any references here are made solely for identification or informational purposes, without implying any affiliation, endorsement, or partnership.
We make no representations or warranties, express or implied, regarding the accuracy, completeness, or suitability of any content or products presented. Nothing on this website should be construed as legal, tax, investment, financial, medical, or other professional advice. In addition, no part of this site—including articles or product references—constitutes a solicitation, recommendation, endorsement, advertisement, or offer to buy or sell any securities, franchises, or other financial instruments, particularly in jurisdictions where such activity would be unlawful.
All content is of a general nature and may not address the specific circumstances of any individual or entity. It is not a substitute for professional advice or services. Any actions you take based on the information provided here are strictly at your own risk. You accept full responsibility for any decisions or outcomes arising from your use of this website and agree to release us from any liability in connection with your use of, or reliance upon, the content or products found herein.