
|
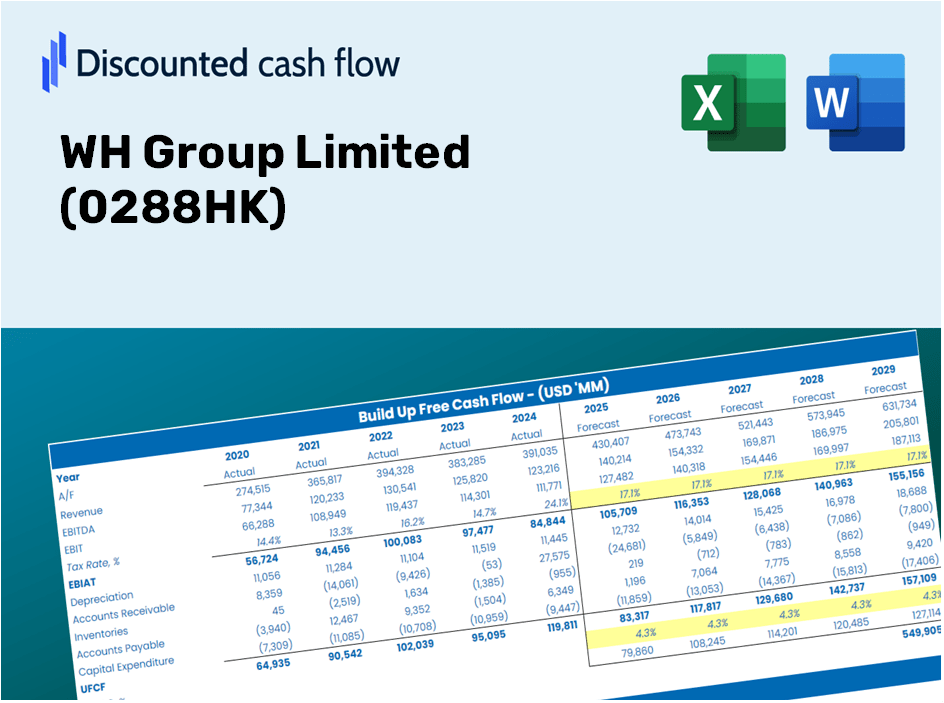
WH Group Limited (0288.HK) DCF Valuation |
Fully Editable: Tailor To Your Needs In Excel Or Sheets
Professional Design: Trusted, Industry-Standard Templates
Investor-Approved Valuation Models
MAC/PC Compatible, Fully Unlocked
No Expertise Is Needed; Easy To Follow
WH Group Limited (0288.HK) Bundle
Enhance your investment strategies with the WH Group Limited (0288HK) DCF Calculator! Utilize real financial data, adjust growth projections and expenses, and observe the immediate effects on WH Group Limited's intrinsic value.
What You Will Receive
- Genuine WH Group Financial Data: Pre-loaded with historical and forecasted data for effective analysis.
- Completely Customizable Template: Easily adjust critical inputs such as revenue growth, WACC, and EBITDA percentage.
- Instant Calculations: Watch WH Group's intrinsic value change live as you modify inputs.
- Comprehensive Valuation Tool: Tailored for investors, analysts, and consultants aiming for precise DCF outcomes.
- Intuitive Layout: Streamlined design and straightforward instructions suitable for all skill levels.
Key Features
- Comprehensive DCF Calculator: Features detailed unlevered and levered DCF valuation models tailored for WH Group Limited (0288HK).
- WACC Calculation Tool: Pre-configured Weighted Average Cost of Capital sheet with adjustable parameters.
- Customizable Forecast Assumptions: Easily adjust growth rates, capital expenditures, and discount rates.
- Integrated Financial Ratios: Evaluate profitability, leverage, and efficiency ratios specifically for WH Group Limited (0288HK).
- Interactive Dashboard and Charts: Visual representations of key valuation metrics for streamlined analysis.
How It Functions
- 1. Open the Template: Download and access the Excel file containing WH Group Limited’s (0288HK) preloaded data.
- 2. Modify Assumptions: Adjust essential inputs such as growth rates, WACC, and capital expenditures.
- 3. View Immediate Results: The DCF model automatically calculates intrinsic value and NPV.
- 4. Explore Scenarios: Evaluate various forecasts to analyze different valuation results.
- 5. Utilize with Assurance: Present expert valuation insights to bolster your decisions.
Why Opt for WH Group Limited (0288HK) Calculator?
- Time-Efficient: Skip the hassle of building a DCF model from the ground up – it’s ready for immediate use.
- Enhanced Accuracy: Trustworthy financial data and formulas minimize valuation errors.
- Completely Customizable: Adjust the model to align with your specific assumptions and forecasts.
- User-Friendly: Intuitive charts and outputs simplify result analysis.
- Endorsed by Professionals: Crafted for experts who prioritize precision and functionality.
Who Can Benefit from WH Group Limited (0288HK)?
- Investors: Gain the confidence to make informed choices with a reliable valuation tool designed for professionals.
- Financial Analysts: Enhance efficiency with a customizable pre-built DCF model tailored for your analysis.
- Consultants: Effortlessly modify the template for impactful presentations or detailed client reports.
- Finance Enthusiasts: Broaden your knowledge of valuation methods through practical, real-world applications.
- Educators and Students: Utilize this resource as an effective learning aid in finance-related coursework.
What the Template Includes
- Operating and Balance Sheet Data: Pre-filled historical data and forecasts for WH Group Limited (0288HK), covering metrics such as revenue, EBITDA, EBIT, and capital expenditures.
- WACC Calculation: A dedicated sheet for calculating the Weighted Average Cost of Capital (WACC), featuring parameters like Beta, risk-free rate, and share price.
- DCF Valuation (Unlevered and Levered): Customizable Discounted Cash Flow models that illustrate intrinsic value with comprehensive calculations.
- Financial Statements: Pre-loaded annual and quarterly financial statements to facilitate thorough analysis.
- Key Ratios: A collection of profitability, leverage, and efficiency ratios specifically for WH Group Limited (0288HK).
- Dashboard and Charts: A visual overview of valuation outputs and assumptions, enabling straightforward result analysis.
Disclaimer
All information, articles, and product details provided on this website are for general informational and educational purposes only. We do not claim any ownership over, nor do we intend to infringe upon, any trademarks, copyrights, logos, brand names, or other intellectual property mentioned or depicted on this site. Such intellectual property remains the property of its respective owners, and any references here are made solely for identification or informational purposes, without implying any affiliation, endorsement, or partnership.
We make no representations or warranties, express or implied, regarding the accuracy, completeness, or suitability of any content or products presented. Nothing on this website should be construed as legal, tax, investment, financial, medical, or other professional advice. In addition, no part of this site—including articles or product references—constitutes a solicitation, recommendation, endorsement, advertisement, or offer to buy or sell any securities, franchises, or other financial instruments, particularly in jurisdictions where such activity would be unlawful.
All content is of a general nature and may not address the specific circumstances of any individual or entity. It is not a substitute for professional advice or services. Any actions you take based on the information provided here are strictly at your own risk. You accept full responsibility for any decisions or outcomes arising from your use of this website and agree to release us from any liability in connection with your use of, or reliance upon, the content or products found herein.