
|
Maanshan Iron & Steel Company Limited (0323.HK) DCF Valuation |
Fully Editable: Tailor To Your Needs In Excel Or Sheets
Professional Design: Trusted, Industry-Standard Templates
Investor-Approved Valuation Models
MAC/PC Compatible, Fully Unlocked
No Expertise Is Needed; Easy To Follow
Maanshan Iron & Steel Company Limited (0323.HK) Bundle
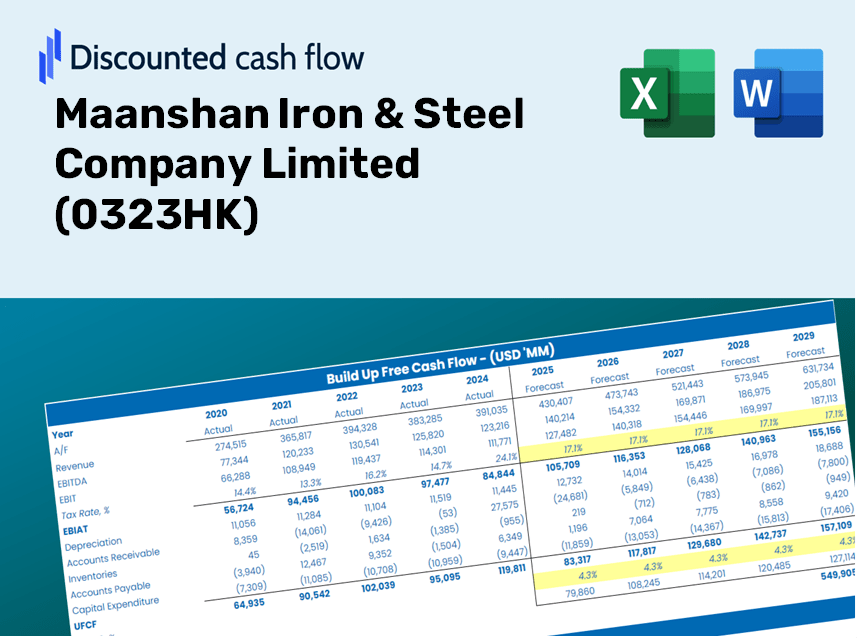
Looking to determine the intrinsic value of Maanshan Iron & Steel Company Limited? Our (0323HK) DCF Calculator integrates real-world data with comprehensive customization features, enabling you to adjust forecasts and make more informed investment choices.
Discounted Cash Flow (DCF) - (USD MM)
| Year | AY1 2020 |
AY2 2021 |
AY3 2022 |
AY4 2023 |
AY5 2024 |
FY1 2025 |
FY2 2026 |
FY3 2027 |
FY4 2028 |
FY5 2029 |
|---|---|---|---|---|---|---|---|---|---|---|
| Revenue | 89,088.7 | 124,278.1 | 111,509.2 | 107,999.1 | 89,310.0 | 91,268.6 | 93,270.2 | 95,315.6 | 97,405.9 | 99,542.1 |
| Revenue Growth, % | 0 | 39.5 | -10.27 | -3.15 | -17.3 | 2.19 | 2.19 | 2.19 | 2.19 | 2.19 |
| EBITDA | 7,519.7 | 11,900.7 | 3,485.6 | 2,971.2 | 301.1 | 4,423.0 | 4,520.0 | 4,619.1 | 4,720.4 | 4,823.9 |
| EBITDA, % | 8.44 | 9.58 | 3.13 | 2.75 | 0.33712 | 4.85 | 4.85 | 4.85 | 4.85 | 4.85 |
| Depreciation | 3,452.3 | 3,526.5 | 3,577.5 | 4,161.0 | 4,925.0 | 3,520.8 | 3,598.0 | 3,676.9 | 3,757.6 | 3,840.0 |
| Depreciation, % | 3.88 | 2.84 | 3.21 | 3.85 | 5.51 | 3.86 | 3.86 | 3.86 | 3.86 | 3.86 |
| EBIT | 4,067.4 | 8,374.2 | -91.9 | -1,189.8 | -4,623.9 | 902.2 | 922.0 | 942.2 | 962.9 | 984.0 |
| EBIT, % | 4.57 | 6.74 | -0.08238326 | -1.1 | -5.18 | 0.9885 | 0.9885 | 0.9885 | 0.9885 | 0.9885 |
| Total Cash | 8,050.5 | 13,536.0 | 7,816.5 | 6,079.9 | 7,023.4 | 7,380.3 | 7,542.1 | 7,707.5 | 7,876.5 | 8,049.3 |
| Total Cash, percent | .0 | .0 | .0 | .0 | .0 | .0 | .0 | .0 | .0 | .0 |
| Account Receivables | 8,859.0 | 6,953.3 | 6,516.7 | 5,359.9 | 4,916.3 | 5,813.9 | 5,941.4 | 6,071.7 | 6,204.9 | 6,341.0 |
| Account Receivables, % | 9.94 | 5.59 | 5.84 | 4.96 | 5.5 | 6.37 | 6.37 | 6.37 | 6.37 | 6.37 |
| Inventories | 11,898.6 | 13,604.4 | 11,182.8 | 10,826.6 | 8,633.3 | 9,861.1 | 10,077.4 | 10,298.4 | 10,524.2 | 10,755.0 |
| Inventories, % | 13.36 | 10.95 | 10.03 | 10.02 | 9.67 | 10.8 | 10.8 | 10.8 | 10.8 | 10.8 |
| Accounts Payable | 11,909.1 | 15,709.2 | 24,500.6 | 24,173.5 | 22,623.2 | 17,467.7 | 17,850.8 | 18,242.3 | 18,642.3 | 19,051.2 |
| Accounts Payable, % | 13.37 | 12.64 | 21.97 | 22.38 | 25.33 | 19.14 | 19.14 | 19.14 | 19.14 | 19.14 |
| Capital Expenditure | -7,671.4 | -8,281.1 | -9,106.2 | -6,985.2 | -1,836.5 | -5,834.8 | -5,962.7 | -6,093.5 | -6,227.1 | -6,363.7 |
| Capital Expenditure, % | -8.61 | -6.66 | -8.17 | -6.47 | -2.06 | -6.39 | -6.39 | -6.39 | -6.39 | -6.39 |
| Tax Rate, % | 3.53 | 3.53 | 3.53 | 3.53 | 3.53 | 3.53 | 3.53 | 3.53 | 3.53 | 3.53 |
| EBITAT | 2,617.5 | 6,364.2 | -134.3 | -989.0 | -4,460.5 | 757.7 | 774.3 | 791.3 | 808.7 | 826.4 |
| Depreciation | ||||||||||
| Changes in Account Receivables | ||||||||||
| Changes in Inventories | ||||||||||
| Changes in Accounts Payable | ||||||||||
| Capital Expenditure | ||||||||||
| UFCF | -10,450.1 | 5,609.5 | 5,986.6 | -2,627.3 | -285.3 | -8,837.3 | -1,551.0 | -1,585.0 | -1,619.8 | -1,655.3 |
| WACC, % | 5.97 | 6.17 | 6.59 | 6.29 | 6.53 | 6.31 | 6.31 | 6.31 | 6.31 | 6.31 |
| PV UFCF | ||||||||||
| SUM PV UFCF | -13,491.8 | |||||||||
| Long Term Growth Rate, % | 2.00 | |||||||||
| Free cash flow (T + 1) | -1,688 | |||||||||
| Terminal Value | -39,186 | |||||||||
| Present Terminal Value | -28,860 | |||||||||
| Enterprise Value | -42,351 | |||||||||
| Net Debt | 11,716 | |||||||||
| Equity Value | -54,067 | |||||||||
| Diluted Shares Outstanding, MM | 7,638 | |||||||||
| Equity Value Per Share | -7.08 |
What You Will Receive
- Authentic 0323HK Financial Data: Pre-loaded with Maanshan Iron & Steel's historical and forecasted figures for accurate assessments.
- Completely Customizable Template: Easily adjust critical inputs such as revenue growth, WACC, and EBITDA percentage.
- Instantaneous Calculations: Observe the real-time update of Maanshan Iron & Steel's intrinsic value as you modify your inputs.
- Professional Valuation Tool: Tailored for investors, analysts, and consultants who demand precise DCF outcomes.
- User-Friendly Interface: Intuitive layout and straightforward instructions suitable for all skill levels.
Key Features
- Pre-Loaded Data: Maanshan Iron & Steel's historical financial statements and pre-filled forecasts.
- Fully Adjustable Inputs: Customize WACC, tax rates, revenue growth, and EBITDA margins.
- Instant Results: View Maanshan Iron & Steel's intrinsic value recalculated in real time.
- Clear Visual Outputs: Dashboard charts present valuation results and key metrics.
- Built for Accuracy: A professional tool designed for analysts, investors, and finance professionals.
How It Functions
- Step 1: Download the comprehensive Excel template that includes data for Maanshan Iron & Steel Company Limited (0323HK).
- Step 2: Navigate through the pre-populated sheets to familiarize yourself with the essential metrics.
- Step 3: Modify forecasts and assumptions in the editable yellow cells (WACC, growth rates, margins).
- Step 4: Instantly see updated results, including the intrinsic value of Maanshan Iron & Steel Company Limited (0323HK).
- Step 5: Make well-informed investment choices or create reports based on the generated outputs.
Why Opt for This Calculator?
- Designed for Industry Experts: A sophisticated tool utilized by analysts, CFOs, and consultants in the steel sector.
- Comprehensive Data: Maanshan Iron & Steel’s historical and projected financial figures preloaded for enhanced precision.
- Scenario Simulation: Effortlessly model various projections and assumptions.
- Clear Results: Instantly computes intrinsic value, NPV, and essential financial metrics.
- User-Friendly: Step-by-step guidelines help you navigate the tool with ease.
Who Should Utilize This Product?
- Institutional Investors: Develop comprehensive and precise valuation models for portfolio assessments of Maanshan Iron & Steel Company Limited (0323HK).
- Corporate Finance Departments: Evaluate valuation scenarios to inform strategic decisions within the organization.
- Financial Consultants and Advisors: Deliver accurate valuation analysis to clients interested in Maanshan Iron & Steel Company Limited (0323HK).
- Students and Instructors: Leverage real-time data for hands-on experience in financial modeling and education.
- Industry Enthusiasts: Gain insights into the market valuation of companies like Maanshan Iron & Steel Company Limited (0323HK).
Contents of the Template
- Pre-Filled DCF Model: Maanshan Iron & Steel's financial data ready for immediate application.
- WACC Calculator: Comprehensive calculations for the Weighted Average Cost of Capital.
- Financial Ratios: Assess Maanshan Iron & Steel's profitability, leverage, and operational efficiency.
- Editable Inputs: Adjust assumptions like growth rates, profit margins, and capital expenditures to match your scenarios.
- Financial Statements: Annual and quarterly reports for in-depth analysis support.
- Interactive Dashboard: Effortlessly visualize essential valuation metrics and outcomes.
Disclaimer
All information, articles, and product details provided on this website are for general informational and educational purposes only. We do not claim any ownership over, nor do we intend to infringe upon, any trademarks, copyrights, logos, brand names, or other intellectual property mentioned or depicted on this site. Such intellectual property remains the property of its respective owners, and any references here are made solely for identification or informational purposes, without implying any affiliation, endorsement, or partnership.
We make no representations or warranties, express or implied, regarding the accuracy, completeness, or suitability of any content or products presented. Nothing on this website should be construed as legal, tax, investment, financial, medical, or other professional advice. In addition, no part of this site—including articles or product references—constitutes a solicitation, recommendation, endorsement, advertisement, or offer to buy or sell any securities, franchises, or other financial instruments, particularly in jurisdictions where such activity would be unlawful.
All content is of a general nature and may not address the specific circumstances of any individual or entity. It is not a substitute for professional advice or services. Any actions you take based on the information provided here are strictly at your own risk. You accept full responsibility for any decisions or outcomes arising from your use of this website and agree to release us from any liability in connection with your use of, or reliance upon, the content or products found herein.