
|
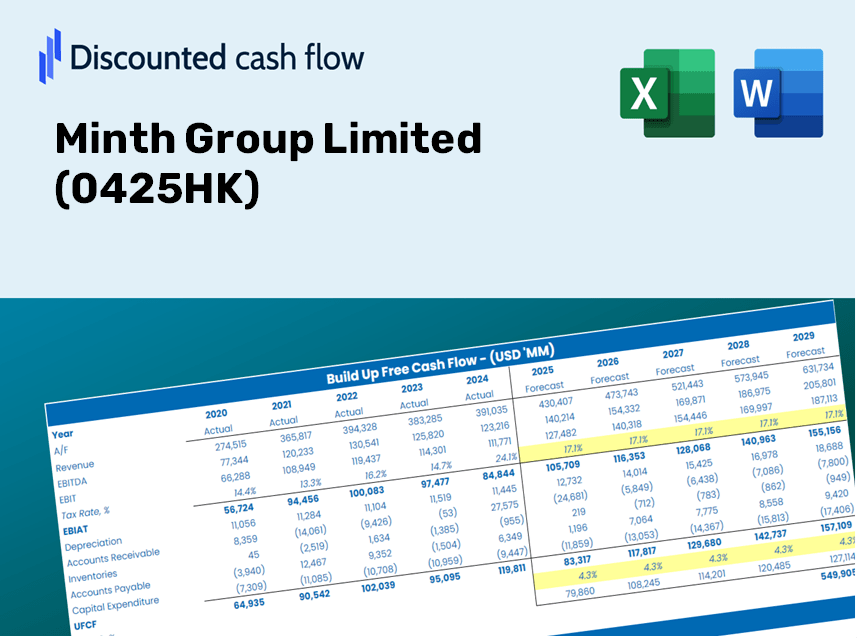
Minth Group Limited (0425.HK) DCF Valuation |
Fully Editable: Tailor To Your Needs In Excel Or Sheets
Professional Design: Trusted, Industry-Standard Templates
Investor-Approved Valuation Models
MAC/PC Compatible, Fully Unlocked
No Expertise Is Needed; Easy To Follow
Minth Group Limited (0425.HK) Bundle
Streamline your analysis and improve precision with our (0425HK) DCF Calculator! Utilizing real data from Minth Group Limited and customizable assumptions, this tool empowers you to forecast, analyze, and value (0425HK) like a seasoned investor.
Discounted Cash Flow (DCF) - (USD MM)
| Year | AY1 2020 |
AY2 2021 |
AY3 2022 |
AY4 2023 |
AY5 2024 |
FY1 2025 |
FY2 2026 |
FY3 2027 |
FY4 2028 |
FY5 2029 |
|---|---|---|---|---|---|---|---|---|---|---|
| Revenue | 13,632.4 | 15,220.6 | 18,924.4 | 22,442.5 | 25,311.2 | 29,573.5 | 34,553.4 | 40,371.9 | 47,170.2 | 55,113.3 |
| Revenue Growth, % | 0 | 11.65 | 24.33 | 18.59 | 12.78 | 16.84 | 16.84 | 16.84 | 16.84 | 16.84 |
| EBITDA | 2,566.6 | 2,194.2 | 2,681.0 | 3,569.4 | 4,208.6 | 4,728.4 | 5,524.6 | 6,454.9 | 7,541.8 | 8,811.8 |
| EBITDA, % | 18.83 | 14.42 | 14.17 | 15.9 | 16.63 | 15.99 | 15.99 | 15.99 | 15.99 | 15.99 |
| Depreciation | 894.8 | 927.2 | 1,136.2 | 1,424.3 | 1,424.3 | 1,811.9 | 2,117.0 | 2,473.5 | 2,890.0 | 3,376.7 |
| Depreciation, % | 6.56 | 6.09 | 6 | 6.35 | 5.63 | 6.13 | 6.13 | 6.13 | 6.13 | 6.13 |
| EBIT | 1,671.7 | 1,267.0 | 1,544.8 | 2,145.1 | 2,784.3 | 2,916.5 | 3,407.6 | 3,981.4 | 4,651.8 | 5,435.2 |
| EBIT, % | 12.26 | 8.32 | 8.16 | 9.56 | 11 | 9.86 | 9.86 | 9.86 | 9.86 | 9.86 |
| Total Cash | 7,228.4 | 6,126.6 | 4,794.3 | 5,194.3 | 3,220.6 | 9,136.9 | 10,675.5 | 12,473.1 | 14,573.5 | 17,027.6 |
| Total Cash, percent | .0 | .0 | .0 | .0 | .0 | .0 | .0 | .0 | .0 | .0 |
| Account Receivables | 3,877.4 | 3,833.5 | 5,400.8 | 5,470.8 | 6,593.2 | 7,842.5 | 9,163.1 | 10,706.1 | 12,508.9 | 14,615.3 |
| Account Receivables, % | 28.44 | 25.19 | 28.54 | 24.38 | 26.05 | 26.52 | 26.52 | 26.52 | 26.52 | 26.52 |
| Inventories | 2,622.4 | 3,237.7 | 3,972.8 | 4,354.5 | 5,074.8 | 5,971.1 | 6,976.6 | 8,151.4 | 9,524.0 | 11,127.8 |
| Inventories, % | 19.24 | 21.27 | 20.99 | 19.4 | 20.05 | 20.19 | 20.19 | 20.19 | 20.19 | 20.19 |
| Accounts Payable | 2,679.3 | 2,737.3 | 3,872.7 | 4,754.1 | 5,307.9 | 5,929.8 | 6,928.4 | 8,095.1 | 9,458.2 | 11,050.9 |
| Accounts Payable, % | 19.65 | 17.98 | 20.46 | 21.18 | 20.97 | 20.05 | 20.05 | 20.05 | 20.05 | 20.05 |
| Capital Expenditure | -2,420.3 | -3,435.9 | -3,652.4 | -3,585.8 | -2,119.0 | -4,967.0 | -5,803.4 | -6,780.7 | -7,922.5 | -9,256.6 |
| Capital Expenditure, % | -17.75 | -22.57 | -19.3 | -15.98 | -8.37 | -16.8 | -16.8 | -16.8 | -16.8 | -16.8 |
| Tax Rate, % | 17.37 | 17.37 | 17.37 | 17.37 | 17.37 | 17.37 | 17.37 | 17.37 | 17.37 | 17.37 |
| EBITAT | 1,389.0 | 1,027.3 | 1,303.0 | 1,763.2 | 2,300.6 | 2,410.9 | 2,816.9 | 3,291.3 | 3,845.5 | 4,493.1 |
| Depreciation | ||||||||||
| Changes in Account Receivables | ||||||||||
| Changes in Inventories | ||||||||||
| Changes in Accounts Payable | ||||||||||
| Capital Expenditure | ||||||||||
| UFCF | -3,957.0 | -1,994.8 | -2,380.2 | 31.4 | 317.0 | -2,267.8 | -2,197.1 | -2,567.0 | -2,999.3 | -3,504.3 |
| WACC, % | 8.28 | 8.26 | 8.3 | 8.27 | 8.28 | 8.28 | 8.28 | 8.28 | 8.28 | 8.28 |
| PV UFCF | ||||||||||
| SUM PV UFCF | -10,527.0 | |||||||||
| Long Term Growth Rate, % | 2.00 | |||||||||
| Free cash flow (T + 1) | -3,574 | |||||||||
| Terminal Value | -56,934 | |||||||||
| Present Terminal Value | -38,253 | |||||||||
| Enterprise Value | -48,780 | |||||||||
| Net Debt | 6,629 | |||||||||
| Equity Value | -55,409 | |||||||||
| Diluted Shares Outstanding, MM | 1,149 | |||||||||
| Equity Value Per Share | -48.24 |
Benefits You Will Receive
- Accurate 0425HK Financial Data: Access historical and projected figures for precise valuation.
- Customizable Inputs: Adjust WACC, tax rates, revenue growth, and capital expenditures as needed.
- Automatic Calculations: Intrinsic value and NPV are computed in real-time.
- Scenario Analysis: Explore various scenarios to assess the future performance of Minth Group Limited.
- User-Friendly Design: Designed for professionals, yet approachable for newcomers.
Key Features
- Authentic Minth Group Data: Pre-populated with Minth Group Limited's historical financial performance and future projections.
- Customizable Parameters: Modify growth rates, profit margins, discount rates, tax figures, and capital expenses to fit your analysis.
- Interactive Valuation Model: Instantaneous updates to Net Present Value (NPV) and intrinsic value based on your customized inputs.
- Scenario Analysis: Construct various forecast scenarios to evaluate a range of valuation possibilities.
- Intuitive User Interface: Streamlined, organized design suitable for both experts and novices.
How It Operates
- Download the Template: Gain immediate access to the Excel-based Minth Group Limited (0425HK) DCF Calculator.
- Input Your Assumptions: Modify the yellow-highlighted cells for projections like growth rates, WACC, margins, and more.
- Instant Calculations: The model automatically recalculates the intrinsic value of Minth Group Limited (0425HK).
- Test Scenarios: Experiment with various assumptions to assess potential changes in valuation.
- Analyze and Decide: Leverage the results to inform your investment strategies or financial assessments.
Why Choose the Minth Group Limited (0425HK) Calculator?
- Precision: Utilizing actual Minth Group financials for reliable data.
- Versatility: Tailored for users to easily adjust and test different inputs.
- Efficiency: Avoid the complexities of creating a DCF model from the ground up.
- High-Quality Standards: Crafted with the accuracy and usability expected at the CFO level.
- Accessible: Simple to navigate, making it suitable for users with varying levels of financial modeling knowledge.
Who Should Utilize This Product?
- Investors: Evaluate Minth Group Limited’s (0425HK) valuation before making investment decisions.
- CFOs and Financial Analysts: Optimize valuation workflows and assess financial projections.
- Startup Founders: Discover how leading public companies like Minth Group Limited are valued.
- Consultants: Provide clients with professional valuation reports for informed decision-making.
- Students and Educators: Utilize real-world examples to practice and teach valuation methodologies.
Contents of the Template
- In-Depth DCF Model: Editable template featuring detailed valuation computations.
- Actual Data: Minth Group Limited’s (0425HK) historical and forecasted financials included for thorough analysis.
- Adjustable Parameters: Modify WACC, growth rates, and tax assumptions to explore various scenarios.
- Financial Statements: Comprehensive annual and quarterly reports for enhanced insights.
- Key Ratios: Integrated analysis for assessing profitability, efficiency, and leverage.
- Dashboard with Visual Outputs: Graphs and tables designed for clear, actionable insights.
Disclaimer
All information, articles, and product details provided on this website are for general informational and educational purposes only. We do not claim any ownership over, nor do we intend to infringe upon, any trademarks, copyrights, logos, brand names, or other intellectual property mentioned or depicted on this site. Such intellectual property remains the property of its respective owners, and any references here are made solely for identification or informational purposes, without implying any affiliation, endorsement, or partnership.
We make no representations or warranties, express or implied, regarding the accuracy, completeness, or suitability of any content or products presented. Nothing on this website should be construed as legal, tax, investment, financial, medical, or other professional advice. In addition, no part of this site—including articles or product references—constitutes a solicitation, recommendation, endorsement, advertisement, or offer to buy or sell any securities, franchises, or other financial instruments, particularly in jurisdictions where such activity would be unlawful.
All content is of a general nature and may not address the specific circumstances of any individual or entity. It is not a substitute for professional advice or services. Any actions you take based on the information provided here are strictly at your own risk. You accept full responsibility for any decisions or outcomes arising from your use of this website and agree to release us from any liability in connection with your use of, or reliance upon, the content or products found herein.