
|
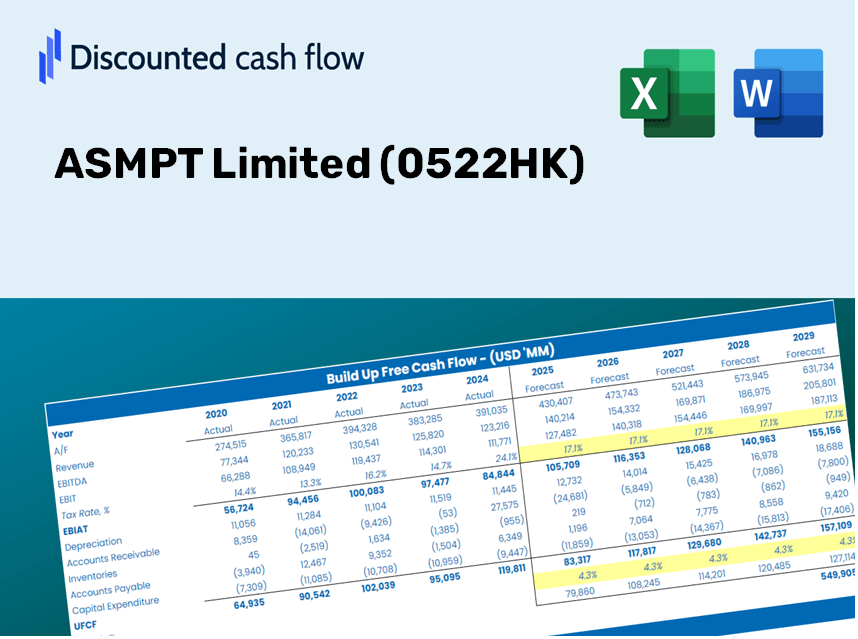
ASMPT Limited (0522.HK) DCF Valuation |
Fully Editable: Tailor To Your Needs In Excel Or Sheets
Professional Design: Trusted, Industry-Standard Templates
Investor-Approved Valuation Models
MAC/PC Compatible, Fully Unlocked
No Expertise Is Needed; Easy To Follow
ASMPT Limited (0522.HK) Bundle
Whether you’re an investor or analyst, this ASMPT Limited (0522HK) DCF Calculator is your go-to resource for accurate valuation. Preloaded with ASMPT Limited's real data, you can adjust forecasts and instantly observe the effects.
Discounted Cash Flow (DCF) - (USD MM)
| Year | AY1 2020 |
AY2 2021 |
AY3 2022 |
AY4 2023 |
AY5 2024 |
FY1 2025 |
FY2 2026 |
FY3 2027 |
FY4 2028 |
FY5 2029 |
|---|---|---|---|---|---|---|---|---|---|---|
| Revenue | 14,700.3 | 21,947.6 | 19,363.5 | 14,697.5 | 13,229.1 | 13,342.8 | 13,457.5 | 13,573.3 | 13,690.0 | 13,807.7 |
| Revenue Growth, % | 0 | 49.3 | -11.77 | -24.1 | -9.99 | 0.85979 | 0.85979 | 0.85979 | 0.85979 | 0.85979 |
| EBITDA | 1,813.1 | 4,790.5 | 4,103.5 | 1,926.0 | 1,387.2 | 2,106.6 | 2,124.7 | 2,143.0 | 2,161.4 | 2,180.0 |
| EBITDA, % | 12.33 | 21.83 | 21.19 | 13.1 | 10.49 | 15.79 | 15.79 | 15.79 | 15.79 | 15.79 |
| Depreciation | 861.2 | 737.5 | 738.6 | 713.2 | 702.5 | 619.0 | 624.3 | 629.7 | 635.1 | 640.6 |
| Depreciation, % | 5.86 | 3.36 | 3.81 | 4.85 | 5.31 | 4.64 | 4.64 | 4.64 | 4.64 | 4.64 |
| EBIT | 952.0 | 4,052.9 | 3,364.9 | 1,212.8 | 684.7 | 1,487.6 | 1,500.4 | 1,513.3 | 1,526.3 | 1,539.5 |
| EBIT, % | 6.48 | 18.47 | 17.38 | 8.25 | 5.18 | 11.15 | 11.15 | 11.15 | 11.15 | 11.15 |
| Total Cash | 4,460.3 | 4,881.7 | 4,410.4 | 4,799.3 | 5,102.5 | 3,911.7 | 3,945.4 | 3,979.3 | 4,013.5 | 4,048.0 |
| Total Cash, percent | .0 | .0 | .0 | .0 | .0 | .0 | .0 | .0 | .0 | .0 |
| Account Receivables | 3,807.8 | 5,375.6 | 4,114.4 | 3,585.7 | 3,568.0 | 3,282.6 | 3,310.9 | 3,339.3 | 3,368.0 | 3,397.0 |
| Account Receivables, % | 25.9 | 24.49 | 21.25 | 24.4 | 26.97 | 24.6 | 24.6 | 24.6 | 24.6 | 24.6 |
| Inventories | 5,773.0 | 7,455.8 | 7,450.2 | 6,315.5 | 5,989.0 | 5,336.0 | 5,381.9 | 5,428.2 | 5,474.9 | 5,521.9 |
| Inventories, % | 39.27 | 33.97 | 38.48 | 42.97 | 45.27 | 39.99 | 39.99 | 39.99 | 39.99 | 39.99 |
| Accounts Payable | 1,454.9 | 2,019.4 | 1,400.3 | 1,152.3 | 1,290.2 | 1,172.1 | 1,182.2 | 1,192.4 | 1,202.6 | 1,212.9 |
| Accounts Payable, % | 9.9 | 9.2 | 7.23 | 7.84 | 9.75 | 8.78 | 8.78 | 8.78 | 8.78 | 8.78 |
| Capital Expenditure | -446.0 | -354.0 | -494.6 | -454.7 | -453.9 | -366.3 | -369.4 | -372.6 | -375.8 | -379.0 |
| Capital Expenditure, % | -3.03 | -1.61 | -2.55 | -3.09 | -3.43 | -2.75 | -2.75 | -2.75 | -2.75 | -2.75 |
| Tax Rate, % | 31.16 | 31.16 | 31.16 | 31.16 | 31.16 | 31.16 | 31.16 | 31.16 | 31.16 | 31.16 |
| EBITAT | 1,868.7 | 3,138.4 | 2,583.3 | 837.4 | 471.3 | 1,166.6 | 1,176.6 | 1,186.7 | 1,197.0 | 1,207.2 |
| Depreciation | ||||||||||
| Changes in Account Receivables | ||||||||||
| Changes in Inventories | ||||||||||
| Changes in Accounts Payable | ||||||||||
| Capital Expenditure | ||||||||||
| UFCF | -5,842.1 | 835.8 | 3,475.0 | 2,511.2 | 1,202.0 | 2,239.6 | 1,367.5 | 1,379.2 | 1,391.1 | 1,403.1 |
| WACC, % | 8.04 | 7.92 | 7.92 | 7.88 | 7.88 | 7.93 | 7.93 | 7.93 | 7.93 | 7.93 |
| PV UFCF | ||||||||||
| SUM PV UFCF | 6,329.6 | |||||||||
| Long Term Growth Rate, % | 2.00 | |||||||||
| Free cash flow (T + 1) | 1,431 | |||||||||
| Terminal Value | 24,147 | |||||||||
| Present Terminal Value | 16,490 | |||||||||
| Enterprise Value | 22,820 | |||||||||
| Net Debt | 143 | |||||||||
| Equity Value | 22,676 | |||||||||
| Diluted Shares Outstanding, MM | 416 | |||||||||
| Equity Value Per Share | 54.49 |
What You Will Receive
- Customizable Excel Template: A fully adaptable Excel-based DCF Calculator featuring pre-filled financial data for ASMPT Limited (0522HK).
- Accurate Data: Access to historical financial information and forward-looking projections (highlighted in the yellow cells).
- Adjustable Forecasts: Easily modify assumptions such as revenue growth, EBITDA percentage, and WACC.
- Instantaneous Calculations: Observe immediate effects of your inputs on the valuation of ASMPT Limited (0522HK).
- Professional-Grade Tool: Designed for use by investors, CFOs, consultants, and financial analysts.
- User-Friendly Layout: Organized for straightforward navigation and simplicity, complete with detailed instructions.
Key Features
- Real-Life ASMPT Data: Pre-filled with ASMPT Limited's historical financials and future projections.
- Fully Customizable Inputs: Modify revenue growth, profit margins, WACC, tax rates, and capital expenditures to suit your analysis.
- Dynamic Valuation Model: Automatic recalculations of Net Present Value (NPV) and intrinsic value based on your customized inputs.
- Scenario Testing: Develop various forecast scenarios to explore different valuation results.
- User-Friendly Design: Intuitively structured for both professionals and novices, ensuring ease of use.
How It Operates
- Download the Template: Gain immediate access to the Excel-based ASMPT Limited (0522HK) DCF Calculator.
- Input Your Assumptions: Modify the yellow-highlighted cells to set your growth rates, WACC, margins, and other inputs.
- Instant Calculations: The model instantly recalculates ASMPT's intrinsic value.
- Test Scenarios: Experiment with various assumptions to see how they impact the valuation.
- Analyze and Decide: Utilize the results to inform your investment strategies or financial evaluations.
Why Choose the ASMPT Limited (0522HK) Calculator?
- Time Efficiency: Skip the hassle of building a DCF model from the ground up – it's all set for immediate use.
- Enhanced Accuracy: Dependable financial data and formulas minimize valuation errors.
- Completely Customizable: Adapt the model to suit your specific assumptions and forecasts.
- Intuitive Visualization: User-friendly charts and outputs simplify the analysis of results.
- Endorsed by Professionals: Crafted for industry experts who prioritize precision and functionality.
Who Should Use ASMPT Limited (0522HK)?
- Finance Students: Acquire skills in valuation methods and practice with authentic data.
- Academics: Integrate industry-standard models into your studies or research projects.
- Investors: Validate your investment hypotheses and evaluate valuation results for ASMPT Limited (0522HK).
- Analysts: Enhance your productivity with a ready-made, adjustable DCF model.
- Small Business Owners: Understand the analytical approaches used for assessing large public companies like ASMPT Limited (0522HK).
Overview of the Template's Contents
- Preloaded ASMPT Data: Historical and projected financial metrics, encompassing revenue, EBIT, and capital expenditures.
- DCF and WACC Models: Sophisticated sheets designed for calculating intrinsic value and Weighted Average Cost of Capital.
- Editable Inputs: Yellow-highlighted cells for modifying revenue growth, tax rates, and discount rates.
- Financial Statements: Detailed annual and quarterly financials for thorough analysis.
- Key Ratios: Important profitability, leverage, and efficiency ratios for performance evaluation.
- Dashboard and Charts: Visual representations of valuation results and underlying assumptions.
Disclaimer
All information, articles, and product details provided on this website are for general informational and educational purposes only. We do not claim any ownership over, nor do we intend to infringe upon, any trademarks, copyrights, logos, brand names, or other intellectual property mentioned or depicted on this site. Such intellectual property remains the property of its respective owners, and any references here are made solely for identification or informational purposes, without implying any affiliation, endorsement, or partnership.
We make no representations or warranties, express or implied, regarding the accuracy, completeness, or suitability of any content or products presented. Nothing on this website should be construed as legal, tax, investment, financial, medical, or other professional advice. In addition, no part of this site—including articles or product references—constitutes a solicitation, recommendation, endorsement, advertisement, or offer to buy or sell any securities, franchises, or other financial instruments, particularly in jurisdictions where such activity would be unlawful.
All content is of a general nature and may not address the specific circumstances of any individual or entity. It is not a substitute for professional advice or services. Any actions you take based on the information provided here are strictly at your own risk. You accept full responsibility for any decisions or outcomes arising from your use of this website and agree to release us from any liability in connection with your use of, or reliance upon, the content or products found herein.