
|
Kerry Properties Limited (0683.HK) DCF Valuation |
Fully Editable: Tailor To Your Needs In Excel Or Sheets
Professional Design: Trusted, Industry-Standard Templates
Investor-Approved Valuation Models
MAC/PC Compatible, Fully Unlocked
No Expertise Is Needed; Easy To Follow
Kerry Properties Limited (0683.HK) Bundle
Looking to assess the intrinsic value of Kerry Properties Limited? Our (0683HK) DCF Calculator integrates real-world data with comprehensive customization features, enabling you to refine your forecasts and enhance your investment strategies.
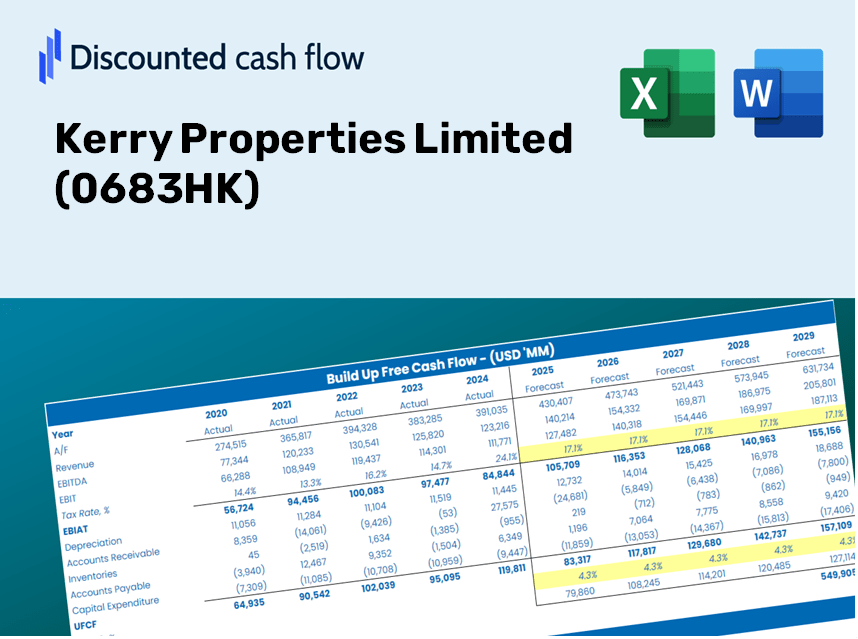
Discounted Cash Flow (DCF) - (USD MM)
| Year | AY1 2020 |
AY2 2021 |
AY3 2022 |
AY4 2023 |
AY5 2024 |
FY1 2025 |
FY2 2026 |
FY3 2027 |
FY4 2028 |
FY5 2029 |
|---|---|---|---|---|---|---|---|---|---|---|
| Revenue | 14,526.1 | 15,326.8 | 14,590.5 | 13,089.6 | 19,499.0 | 21,419.0 | 23,528.1 | 25,844.8 | 28,389.7 | 31,185.1 |
| Revenue Growth, % | 0 | 5.51 | -4.8 | -10.29 | 48.97 | 9.85 | 9.85 | 9.85 | 9.85 | 9.85 |
| EBITDA | 7,371.7 | 7,386.9 | 5,952.3 | 8,127.8 | 4,643.1 | 9,666.2 | 10,618.0 | 11,663.5 | 12,812.0 | 14,073.6 |
| EBITDA, % | 50.75 | 48.2 | 40.8 | 62.09 | 23.81 | 45.13 | 45.13 | 45.13 | 45.13 | 45.13 |
| Depreciation | 477.6 | 520.3 | 482.9 | 444.3 | 342.1 | 648.6 | 712.5 | 782.6 | 859.7 | 944.4 |
| Depreciation, % | 3.29 | 3.39 | 3.31 | 3.39 | 1.75 | 3.03 | 3.03 | 3.03 | 3.03 | 3.03 |
| EBIT | 6,894.1 | 6,866.6 | 5,469.4 | 7,683.5 | 4,301.0 | 9,017.6 | 9,905.5 | 10,880.9 | 11,952.3 | 13,129.2 |
| EBIT, % | 47.46 | 44.8 | 37.49 | 58.7 | 22.06 | 42.1 | 42.1 | 42.1 | 42.1 | 42.1 |
| Total Cash | 17,552.8 | 18,300.1 | 11,701.5 | 13,539.6 | 10,979.0 | 18,699.0 | 20,540.2 | 22,562.8 | 24,784.4 | 27,224.9 |
| Total Cash, percent | .0 | .0 | .0 | .0 | .0 | .0 | .0 | .0 | .0 | .0 |
| Account Receivables | 1,364.7 | 161.5 | 1,551.8 | 1,421.7 | 1,909.0 | 1,787.9 | 1,963.9 | 2,157.3 | 2,369.7 | 2,603.1 |
| Account Receivables, % | 9.39 | 1.05 | 10.64 | 10.86 | 9.79 | 8.35 | 8.35 | 8.35 | 8.35 | 8.35 |
| Inventories | 27,747.3 | 31,169.0 | 43,144.9 | 42,059.9 | 43,480.0 | 21,419.0 | 23,528.1 | 25,844.8 | 28,389.7 | 31,185.1 |
| Inventories, % | 191.02 | 203.36 | 295.71 | 321.32 | 222.99 | 100 | 100 | 100 | 100 | 100 |
| Accounts Payable | 318.8 | 365.3 | 335.8 | 228.7 | 601.0 | 501.6 | 551.0 | 605.3 | 664.9 | 730.3 |
| Accounts Payable, % | 2.19 | 2.38 | 2.3 | 1.75 | 3.08 | 2.34 | 2.34 | 2.34 | 2.34 | 2.34 |
| Capital Expenditure | -5,606.8 | -701.9 | -24,692.1 | -4,982.6 | -5,110.0 | -8,886.7 | -9,761.8 | -10,723.0 | -11,778.8 | -12,938.7 |
| Capital Expenditure, % | -38.6 | -4.58 | -169.23 | -38.07 | -26.21 | -41.49 | -41.49 | -41.49 | -41.49 | -41.49 |
| Tax Rate, % | 68.71 | 68.71 | 68.71 | 68.71 | 68.71 | 68.71 | 68.71 | 68.71 | 68.71 | 68.71 |
| EBITAT | 4,062.5 | 4,999.5 | 2,915.4 | 3,633.0 | 1,345.9 | 4,754.4 | 5,222.5 | 5,736.8 | 6,301.7 | 6,922.2 |
| Depreciation | ||||||||||
| Changes in Account Receivables | ||||||||||
| Changes in Inventories | ||||||||||
| Changes in Accounts Payable | ||||||||||
| Capital Expenditure | ||||||||||
| UFCF | -29,859.9 | 2,645.9 | -34,689.6 | 202.8 | -4,957.1 | 18,599.0 | -6,062.5 | -6,659.4 | -7,315.1 | -8,035.4 |
| WACC, % | 3.58 | 3.92 | 3.45 | 3.3 | 2.91 | 3.43 | 3.43 | 3.43 | 3.43 | 3.43 |
| PV UFCF | ||||||||||
| SUM PV UFCF | -6,882.7 | |||||||||
| Long Term Growth Rate, % | 2.00 | |||||||||
| Free cash flow (T + 1) | -8,196 | |||||||||
| Terminal Value | -572,386 | |||||||||
| Present Terminal Value | -483,521 | |||||||||
| Enterprise Value | -490,404 | |||||||||
| Net Debt | 48,643 | |||||||||
| Equity Value | -539,047 | |||||||||
| Diluted Shares Outstanding, MM | 1,451 | |||||||||
| Equity Value Per Share | -371.42 |
What You'll Receive
- Authentic Kerry Data: Comprehensive financials – covering everything from revenue to EBIT – derived from actual and forecasted information.
- Complete Customization: Modify all essential parameters (yellow cells) such as WACC, growth rates, and tax percentages.
- Immediate Valuation Adjustments: Automatic recalculations to assess the effects of changes on Kerry Properties Limited's fair value.
- Flexible Excel Template: Designed for easy modifications, scenario analysis, and in-depth forecasts.
- Efficient and Precise: Avoid constructing models from the ground up while ensuring both accuracy and adaptability.
Key Features
- 🔍 Real-Life KPL Financials: Pre-filled historical and projected data for Kerry Properties Limited (0683HK).
- ✏️ Fully Customizable Inputs: Modify all essential parameters (yellow cells) such as WACC, growth %, and tax rates.
- 📊 Professional DCF Valuation: Integrated formulas calculate Kerry Properties' intrinsic value using the Discounted Cash Flow method.
- ⚡ Instant Results: View Kerry Properties' valuation immediately after making adjustments.
- Scenario Analysis: Evaluate and compare outcomes for different financial assumptions side-by-side.
How It Functions
- Step 1: Download the Excel file.
- Step 2: Examine the pre-filled financial data and forecasts for Kerry Properties Limited (0683HK).
- Step 3: Adjust key inputs such as revenue growth, WACC, and tax rates (highlighted cells).
- Step 4: Observe the DCF model update in real-time as you modify your assumptions.
- Step 5: Evaluate the results and apply the outputs to inform your investment decisions.
Why Choose This Calculator for Kerry Properties Limited (0683HK)?
- Accurate Data: Utilize real Kerry Properties financials for dependable valuation outcomes.
- Customizable: Tailor essential inputs such as growth rates, WACC, and tax rates to align with your forecasts.
- Time-Saving: Pre-configured calculations save you from having to begin from the ground up.
- Professional-Grade Tool: Crafted for investors, analysts, and consultants in the real estate sector.
- User-Friendly: The intuitive design and guided instructions simplify usage for everyone.
Who Can Benefit from Kerry Properties Limited (0683HK)?
- Investors: Gain confidence in your investment choices with our expert valuation insights.
- Financial Analysts: Streamline your analysis process with a customizable DCF model at your fingertips.
- Consultants: Effortlessly tailor presentations and reports for your clients using our ready-made templates.
- Finance Enthusiasts: Enhance your knowledge of valuation methods through practical, real-world applications.
- Educators and Students: Utilize our resources as an effective learning aid in finance-related courses.
Overview of the Template Components
- In-Depth DCF Model: Fully editable template featuring detailed valuation computations.
- Historical and Projected Data: Kerry Properties Limited’s (0683HK) financial performance and forecasts are preloaded for analysis.
- Adjustable Parameters: Modify WACC, growth rates, and tax assumptions to explore different scenarios.
- Financial Statements: Comprehensive annual and quarterly breakdowns for enhanced insights.
- Essential Ratios: Integrated analysis for profitability, operational efficiency, and capital structure.
- Visual Dashboard: Dynamic charts and tables for clear, actionable insights.
Disclaimer
All information, articles, and product details provided on this website are for general informational and educational purposes only. We do not claim any ownership over, nor do we intend to infringe upon, any trademarks, copyrights, logos, brand names, or other intellectual property mentioned or depicted on this site. Such intellectual property remains the property of its respective owners, and any references here are made solely for identification or informational purposes, without implying any affiliation, endorsement, or partnership.
We make no representations or warranties, express or implied, regarding the accuracy, completeness, or suitability of any content or products presented. Nothing on this website should be construed as legal, tax, investment, financial, medical, or other professional advice. In addition, no part of this site—including articles or product references—constitutes a solicitation, recommendation, endorsement, advertisement, or offer to buy or sell any securities, franchises, or other financial instruments, particularly in jurisdictions where such activity would be unlawful.
All content is of a general nature and may not address the specific circumstances of any individual or entity. It is not a substitute for professional advice or services. Any actions you take based on the information provided here are strictly at your own risk. You accept full responsibility for any decisions or outcomes arising from your use of this website and agree to release us from any liability in connection with your use of, or reliance upon, the content or products found herein.