
|
OHB SE (0FH7.L) DCF Valuation |
Fully Editable: Tailor To Your Needs In Excel Or Sheets
Professional Design: Trusted, Industry-Standard Templates
Investor-Approved Valuation Models
MAC/PC Compatible, Fully Unlocked
No Expertise Is Needed; Easy To Follow
OHB SE (0FH7.L) Bundle
Evaluate OHB SE's financial outlook like a professional! This (0FH7L) DCF Calculator provides you with pre-filled financial data and full flexibility to modify revenue growth, WACC, margins, and other essential assumptions to align with your projections.
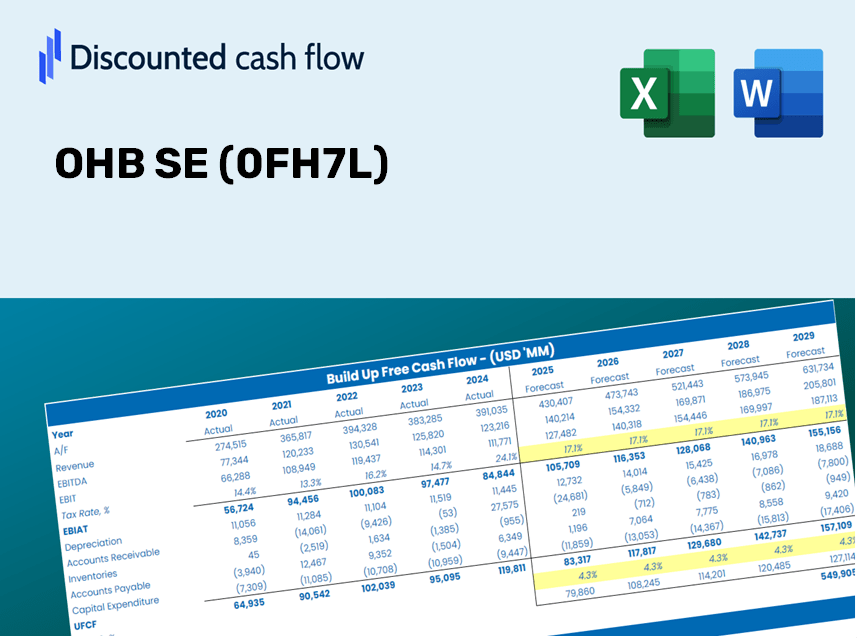
Discounted Cash Flow (DCF) - (USD MM)
| Year | AY1 2020 |
AY2 2021 |
AY3 2022 |
AY4 2023 |
AY5 2024 |
FY1 2025 |
FY2 2026 |
FY3 2027 |
FY4 2028 |
FY5 2029 |
|---|---|---|---|---|---|---|---|---|---|---|
| Revenue | 880.3 | 905.0 | 956.4 | 1,061.9 | 1,001.5 | 1,036.1 | 1,071.9 | 1,109.0 | 1,147.3 | 1,186.9 |
| Revenue Growth, % | 0 | 2.8 | 5.68 | 11.03 | -5.69 | 3.46 | 3.46 | 3.46 | 3.46 | 3.46 |
| EBITDA | 76.1 | 84.8 | 99.9 | 172.8 | 52.4 | 103.6 | 107.1 | 110.8 | 114.7 | 118.6 |
| EBITDA, % | 8.65 | 9.37 | 10.45 | 16.27 | 5.24 | 10 | 10 | 10 | 10 | 10 |
| Depreciation | 35.4 | 36.6 | 36.1 | 12.9 | 39.1 | 35.1 | 36.4 | 37.6 | 38.9 | 40.3 |
| Depreciation, % | 4.02 | 4.04 | 3.77 | 1.22 | 3.9 | 3.39 | 3.39 | 3.39 | 3.39 | 3.39 |
| EBIT | 40.7 | 48.2 | 63.8 | 159.8 | 13.4 | 68.4 | 70.8 | 73.2 | 75.8 | 78.4 |
| EBIT, % | 4.63 | 5.33 | 6.67 | 15.05 | 1.34 | 6.6 | 6.6 | 6.6 | 6.6 | 6.6 |
| Total Cash | 92.5 | 96.6 | 106.1 | 149.9 | 118.0 | 120.5 | 124.7 | 129.0 | 133.5 | 138.1 |
| Total Cash, percent | .0 | .0 | .0 | .0 | .0 | .0 | .0 | .0 | .0 | .0 |
| Account Receivables | 366.2 | 435.7 | 508.5 | 675.6 | 724.5 | 577.9 | 597.9 | 618.5 | 639.9 | 662.0 |
| Account Receivables, % | 41.6 | 48.14 | 53.16 | 63.63 | 72.35 | 55.77 | 55.77 | 55.77 | 55.77 | 55.77 |
| Inventories | 62.1 | 32.0 | 25.7 | 31.4 | 34.6 | 40.8 | 42.2 | 43.7 | 45.2 | 46.7 |
| Inventories, % | 7.05 | 3.54 | 2.68 | 2.95 | 3.46 | 3.94 | 3.94 | 3.94 | 3.94 | 3.94 |
| Accounts Payable | 104.5 | 85.4 | 100.3 | 113.6 | 127.4 | 114.4 | 118.4 | 122.5 | 126.7 | 131.1 |
| Accounts Payable, % | 11.87 | 9.44 | 10.49 | 10.7 | 12.72 | 11.04 | 11.04 | 11.04 | 11.04 | 11.04 |
| Capital Expenditure | -21.2 | -22.6 | -20.5 | -23.8 | -15.3 | -22.4 | -23.2 | -24.0 | -24.8 | -25.6 |
| Capital Expenditure, % | -2.4 | -2.5 | -2.14 | -2.24 | -1.52 | -2.16 | -2.16 | -2.16 | -2.16 | -2.16 |
| Tax Rate, % | 76.16 | 76.16 | 76.16 | 76.16 | 76.16 | 76.16 | 76.16 | 76.16 | 76.16 | 76.16 |
| EBITAT | 28.5 | 31.9 | 41.2 | 109.4 | 3.2 | 40.1 | 41.5 | 42.9 | 44.4 | 45.9 |
| Depreciation | ||||||||||
| Changes in Account Receivables | ||||||||||
| Changes in Inventories | ||||||||||
| Changes in Accounts Payable | ||||||||||
| Capital Expenditure | ||||||||||
| UFCF | -281.0 | -12.6 | 5.2 | -60.9 | -11.4 | 180.4 | 37.2 | 38.5 | 39.9 | 41.2 |
| WACC, % | 6.76 | 6.73 | 6.71 | 6.75 | 6.38 | 6.67 | 6.67 | 6.67 | 6.67 | 6.67 |
| PV UFCF | ||||||||||
| SUM PV UFCF | 294.2 | |||||||||
| Long Term Growth Rate, % | 2.00 | |||||||||
| Free cash flow (T + 1) | 42 | |||||||||
| Terminal Value | 901 | |||||||||
| Present Terminal Value | 653 | |||||||||
| Enterprise Value | 947 | |||||||||
| Net Debt | 77 | |||||||||
| Equity Value | 870 | |||||||||
| Diluted Shares Outstanding, MM | 19 | |||||||||
| Equity Value Per Share | 45.41 |
Benefits You Will Receive
- Pre-Filled Financial Model: Utilize OHB SE’s actual data for accurate DCF valuation.
- Comprehensive Forecast Control: Customize revenue growth, margins, WACC, and other essential parameters.
- Real-Time Calculations: Immediate updates display results as you modify inputs.
- Professional-Grade Template: An expertly crafted Excel file designed for investor-level valuation.
- Flexible and Repeatable: Adapted for versatility, allowing for multiple uses in detailed forecasting.
Key Features
- Pre-Loaded Data: OHB SE’s historical financial statements and pre-filled forecasts.
- Fully Adjustable Inputs: Modify WACC, tax rates, revenue growth, and EBITDA margins as needed.
- Instant Results: View OHB SE’s intrinsic value recalculating in real time.
- Clear Visual Outputs: Dashboard charts illustrate valuation results and essential metrics.
- Built for Accuracy: A professional-grade tool for analysts, investors, and finance professionals.
How It Works
- Step 1: Download the Excel file for OHB SE (0FH7L).
- Step 2: Examine the pre-filled financial data and forecasts for OHB SE (0FH7L).
- Step 3: Adjust key inputs such as revenue growth, WACC, and tax rates (highlighted cells).
- Step 4: Observe the DCF model update in real-time as you modify the assumptions.
- Step 5: Evaluate the outputs to inform your investment decisions regarding OHB SE (0FH7L).
Why Choose the OHB SE (0FH7L) Calculator?
- Precision: Utilizes genuine OHB financial data to guarantee accurate results.
- Versatility: Tailored for users to easily manipulate and experiment with inputs.
- Efficiency: Eliminate the tedious process of creating a DCF model from the ground up.
- Expert-Quality: Crafted with the expertise and usability expected at the CFO level.
- Intuitive: Simple to navigate, perfect for users without extensive financial modeling expertise.
Who Should Utilize This Product?
- Investors: Evaluate OHB SE’s (0FH7L) valuation prior to making stock transactions.
- CFOs and Financial Analysts: Enhance valuation workflows and validate financial projections.
- Startup Founders: Discover the valuation methods applied to prominent public firms like OHB SE.
- Consultants: Provide detailed valuation reports for your clients with confidence.
- Students and Educators: Leverage real market data to refine and teach valuation strategies.
Contents of the Template
- Pre-Filled DCF Model: OHB SE's financial data preloaded for immediate application.
- WACC Calculator: Comprehensive calculations for the Weighted Average Cost of Capital.
- Financial Ratios: Assess OHB SE's profitability, leverage, and operational efficiency.
- Editable Inputs: Adjust assumptions like growth rates, profit margins, and CAPEX to fit your specific scenarios.
- Financial Statements: Access annual and quarterly reports for in-depth analysis.
- Interactive Dashboard: Effortlessly visualize key valuation metrics and outcomes.
Disclaimer
All information, articles, and product details provided on this website are for general informational and educational purposes only. We do not claim any ownership over, nor do we intend to infringe upon, any trademarks, copyrights, logos, brand names, or other intellectual property mentioned or depicted on this site. Such intellectual property remains the property of its respective owners, and any references here are made solely for identification or informational purposes, without implying any affiliation, endorsement, or partnership.
We make no representations or warranties, express or implied, regarding the accuracy, completeness, or suitability of any content or products presented. Nothing on this website should be construed as legal, tax, investment, financial, medical, or other professional advice. In addition, no part of this site—including articles or product references—constitutes a solicitation, recommendation, endorsement, advertisement, or offer to buy or sell any securities, franchises, or other financial instruments, particularly in jurisdictions where such activity would be unlawful.
All content is of a general nature and may not address the specific circumstances of any individual or entity. It is not a substitute for professional advice or services. Any actions you take based on the information provided here are strictly at your own risk. You accept full responsibility for any decisions or outcomes arising from your use of this website and agree to release us from any liability in connection with your use of, or reliance upon, the content or products found herein.