
|
Centennial Resource Development, Inc. (0HVD.L) DCF Valuation |
Fully Editable: Tailor To Your Needs In Excel Or Sheets
Professional Design: Trusted, Industry-Standard Templates
Investor-Approved Valuation Models
MAC/PC Compatible, Fully Unlocked
No Expertise Is Needed; Easy To Follow
Permian Resources Corporation (0HVD.L) Bundle
Save time and improve precision with our (0HVDL) DCF Calculator! With real data from Centennial Resource Development, Inc. and customizable assumptions, this tool allows you to forecast, analyze, and value (0HVDL) like a seasoned investor.
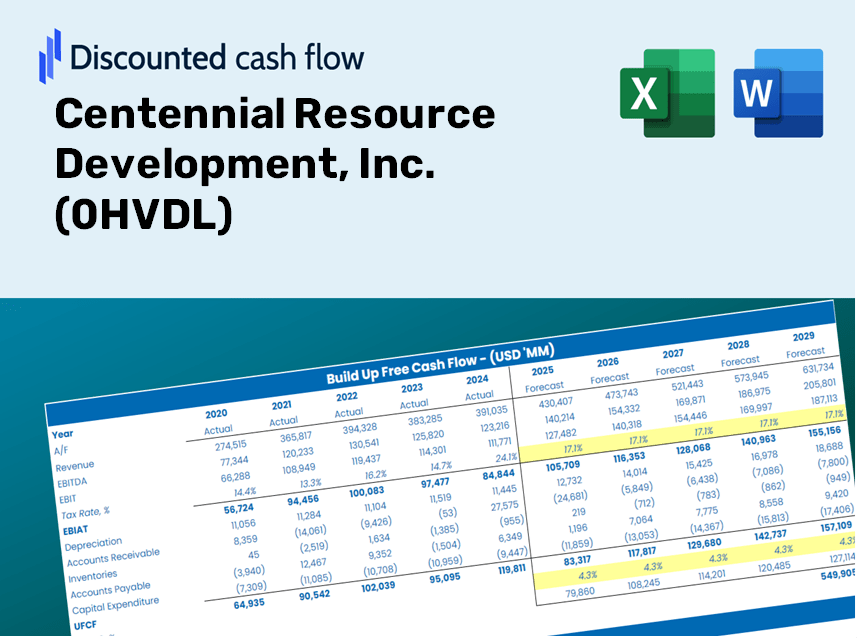
Discounted Cash Flow (DCF) - (USD MM)
| Year | AY1 2020 |
AY2 2021 |
AY3 2022 |
AY4 2023 |
AY5 2024 |
FY1 2025 |
FY2 2026 |
FY3 2027 |
FY4 2028 |
FY5 2029 |
|---|---|---|---|---|---|---|---|---|---|---|
| Revenue | 580.5 | 1,029.9 | 2,131.3 | 3,120.9 | 5,000.7 | 8,552.5 | 14,626.8 | 25,015.3 | 42,782.1 | 73,167.6 |
| Revenue Growth, % | 0 | 77.43 | 106.94 | 46.43 | 60.23 | 71.02 | 71.02 | 71.02 | 71.02 | 71.02 |
| EBITDA | -336.0 | 489.2 | 1,410.5 | 2,349.9 | 3,632.3 | 3,484.7 | 5,959.7 | 10,192.5 | 17,431.7 | 29,812.4 |
| EBITDA, % | -57.88 | 47.5 | 66.18 | 75.3 | 72.63 | 40.75 | 40.75 | 40.75 | 40.75 | 40.75 |
| Depreciation | 365.2 | 289.1 | 444.7 | 1,014.3 | 1,776.7 | 3,076.8 | 5,262.0 | 8,999.3 | 15,390.9 | 26,322.1 |
| Depreciation, % | 62.91 | 28.07 | 20.86 | 32.5 | 35.53 | 35.98 | 35.98 | 35.98 | 35.98 | 35.98 |
| EBIT | -701.1 | 200.0 | 965.8 | 1,335.6 | 1,855.6 | 763.6 | 1,305.9 | 2,233.4 | 3,819.7 | 6,532.5 |
| EBIT, % | -120.79 | 19.42 | 45.31 | 42.8 | 37.11 | 8.93 | 8.93 | 8.93 | 8.93 | 8.93 |
| Total Cash | 5.8 | 9.9 | 69.9 | 73.3 | 479.3 | 293.8 | 502.5 | 859.5 | 1,469.9 | 2,513.9 |
| Total Cash, percent | .0 | .0 | .0 | .0 | .0 | .0 | .0 | .0 | .0 | .0 |
| Account Receivables | 54.4 | 69.7 | 264.6 | 481.1 | 530.5 | 933.7 | 1,596.9 | 2,731.1 | 4,670.8 | 7,988.3 |
| Account Receivables, % | 9.38 | 6.77 | 12.42 | 15.41 | 10.61 | 10.92 | 10.92 | 10.92 | 10.92 | 10.92 |
| Inventories | .0 | .0 | .0 | .0 | .0 | .0 | .0 | .0 | .0 | .0 |
| Inventories, % | 0 | 0 | 0 | 0 | 0 | 0 | 0 | 0 | 0 | 0 |
| Accounts Payable | 5.1 | 9.7 | 51.4 | 94.5 | 46.0 | 139.9 | 239.2 | 409.1 | 699.7 | 1,196.7 |
| Accounts Payable, % | 0.87035 | 0.94534 | 2.41 | 3.03 | 0.91917 | 1.64 | 1.64 | 1.64 | 1.64 | 1.64 |
| Capital Expenditure | -328.0 | -327.1 | -784.0 | -1,793.7 | -3,120.6 | -4,189.5 | -7,165.0 | -12,253.8 | -20,957.0 | -35,841.5 |
| Capital Expenditure, % | -56.51 | -31.76 | -36.79 | -57.47 | -62.4 | -48.99 | -48.99 | -48.99 | -48.99 | -48.99 |
| Tax Rate, % | 36.17 | 36.17 | 36.17 | 36.17 | 36.17 | 36.17 | 36.17 | 36.17 | 36.17 | 36.17 |
| EBITAT | -621.5 | 199.2 | 571.6 | 614.3 | 1,184.4 | 545.6 | 933.0 | 1,595.7 | 2,729.1 | 4,667.4 |
| Depreciation | ||||||||||
| Changes in Account Receivables | ||||||||||
| Changes in Inventories | ||||||||||
| Changes in Accounts Payable | ||||||||||
| Capital Expenditure | ||||||||||
| UFCF | -633.7 | 150.7 | 79.1 | -338.5 | -257.5 | -876.5 | -1,533.8 | -2,623.1 | -4,486.2 | -7,672.4 |
| WACC, % | 6.76 | 7 | 6.11 | 5.82 | 6.21 | 6.38 | 6.38 | 6.38 | 6.38 | 6.38 |
| PV UFCF | ||||||||||
| SUM PV UFCF | -13,492.2 | |||||||||
| Long Term Growth Rate, % | 2.00 | |||||||||
| Free cash flow (T + 1) | -7,826 | |||||||||
| Terminal Value | -178,627 | |||||||||
| Present Terminal Value | -131,106 | |||||||||
| Enterprise Value | -144,598 | |||||||||
| Net Debt | 3,842 | |||||||||
| Equity Value | -148,441 | |||||||||
| Diluted Shares Outstanding, MM | 684 | |||||||||
| Equity Value Per Share | -216.86 |
What You Will Receive
- Accurate CDEV Financial Data: Pre-loaded with Centennial Resource Development's historical and projected figures for precise evaluation.
- Fully Customizable Template: Effortlessly adjust critical inputs such as revenue growth, WACC, and EBITDA percentage.
- Instant Calculations: Watch the intrinsic value of CDEV update in real-time as you make adjustments.
- Professional Valuation Tool: Tailored for investors, analysts, and consultants aiming for reliable DCF outcomes.
- User-Friendly Interface: Intuitive layout and straightforward instructions suitable for all skill levels.
Core Highlights
- Authentic Centennial Financials: Gain access to precise, pre-loaded historical data and future forecasts.
- Adjustable Forecast Parameters: Modify the highlighted cells for metrics like WACC, growth rates, and profit margins.
- Real-Time Calculations: Automatic updates for DCF, Net Present Value (NPV), and cash flow assessments.
- User-Friendly Dashboard: Intuitive charts and summaries to effectively showcase your valuation results.
- Designed for All Users: A straightforward, easy-to-navigate layout tailored for investors, CFOs, and consultants alike.
How It Works
- Step 1: Download the Excel file for Centennial Resource Development, Inc. (0HVDL).
- Step 2: Examine the pre-filled financial data and forecasts provided for (0HVDL).
- Step 3: Adjust key inputs such as revenue growth, WACC, and tax rates (highlighted cells).
- Step 4: Observe the DCF model refresh in real-time as you modify your assumptions.
- Step 5: Evaluate the outputs and apply the findings to inform your investment choices.
Why Choose the Centennial Resource Development Calculator?
- Precision: Utilizes real Centennial financial data to guarantee accurate results.
- Adaptability: Crafted to allow users to easily test and adjust inputs as needed.
- Efficiency: Eliminate the complexities of building a financial model from the ground up.
- High-Quality: Engineered with the expertise and standards expected at a CFO level.
- Accessible: Intuitive design makes it simple for anyone, regardless of their financial modeling background.
Who Can Benefit from This Product?
- Professional Investors: Create comprehensive and accurate valuation models for analyzing portfolios focused on Centennial Resource Development, Inc. (0HVDL).
- Corporate Finance Teams: Evaluate valuation scenarios to inform strategic decisions within the organization.
- Consultants and Advisors: Deliver precise valuation insights to clients interested in investing in Centennial Resource Development, Inc. (0HVDL).
- Students and Educators: Leverage real-world data to learn and teach financial modeling techniques.
- Energy Sector Enthusiasts: Gain insights into how companies like Centennial Resource Development, Inc. (0HVDL) are evaluated in the market.
Contents of the Template
- Pre-Filled Data: Contains Centennial Resource Development's historical financial performance and projections.
- Discounted Cash Flow Model: Editable DCF valuation model with automated calculations for accurate assessments.
- Weighted Average Cost of Capital (WACC): A dedicated worksheet for computing WACC based on your specific inputs.
- Key Financial Ratios: Evaluate Centennial Resource Development's profitability, efficiency, and leverage metrics.
- Customizable Inputs: Easily modify revenue growth rates, profit margins, and tax rates as needed.
- Intuitive Dashboard: Visual charts and tables that summarize essential valuation outcomes.
Disclaimer
All information, articles, and product details provided on this website are for general informational and educational purposes only. We do not claim any ownership over, nor do we intend to infringe upon, any trademarks, copyrights, logos, brand names, or other intellectual property mentioned or depicted on this site. Such intellectual property remains the property of its respective owners, and any references here are made solely for identification or informational purposes, without implying any affiliation, endorsement, or partnership.
We make no representations or warranties, express or implied, regarding the accuracy, completeness, or suitability of any content or products presented. Nothing on this website should be construed as legal, tax, investment, financial, medical, or other professional advice. In addition, no part of this site—including articles or product references—constitutes a solicitation, recommendation, endorsement, advertisement, or offer to buy or sell any securities, franchises, or other financial instruments, particularly in jurisdictions where such activity would be unlawful.
All content is of a general nature and may not address the specific circumstances of any individual or entity. It is not a substitute for professional advice or services. Any actions you take based on the information provided here are strictly at your own risk. You accept full responsibility for any decisions or outcomes arising from your use of this website and agree to release us from any liability in connection with your use of, or reliance upon, the content or products found herein.