
|
Knorr-Bremse Aktiengesellschaft (0KBI.L) DCF Valuation |
Fully Editable: Tailor To Your Needs In Excel Or Sheets
Professional Design: Trusted, Industry-Standard Templates
Investor-Approved Valuation Models
MAC/PC Compatible, Fully Unlocked
No Expertise Is Needed; Easy To Follow
Knorr-Bremse AG (0KBI.L) Bundle
Streamline your analysis and improve precision with our (0KBIL) DCF Calculator! Utilizing real data from Knorr-Bremse Aktiengesellschaft and customizable assumptions, this tool empowers you to forecast, evaluate, and value (0KBIL) like a seasoned investor.
Benefits You Will Receive
- Pre-Loaded Financial Model: Utilize Knorr-Bremse's actual data for accurate DCF valuation.
- Comprehensive Forecasting Control: Modify revenue growth, profit margins, WACC, and other essential drivers.
- Real-Time Calculations: Automatic updates provide immediate results as adjustments are made.
- Professional-Grade Template: A polished Excel file crafted for investor-ready valuation.
- Flexible and Reusable: Designed for adaptability, enabling repeated use for in-depth forecasts.
Key Features
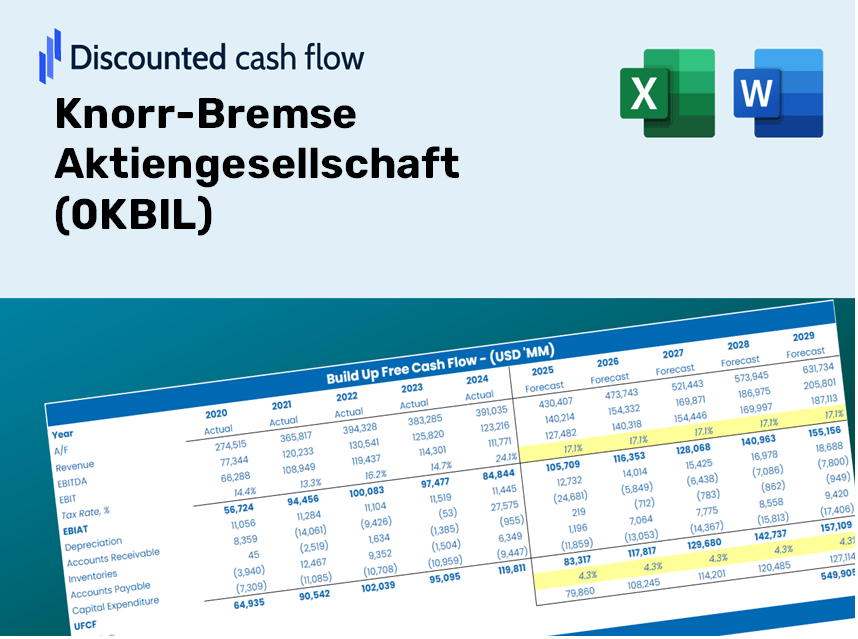
- Pre-Loaded Data: Knorr-Bremse Aktiengesellschaft’s historical financial statements and pre-filled forecasts.
- Fully Adjustable Inputs: Modify WACC, tax rates, revenue growth, and EBITDA margins as needed.
- Instant Results: Watch Knorr-Bremse Aktiengesellschaft’s intrinsic value update in real time.
- Clear Visual Outputs: Dashboard charts present valuation results and essential metrics.
- Built for Accuracy: A professional-grade tool for analysts, investors, and finance professionals.
How It Functions
- Step 1: Download the Excel spreadsheet.
- Step 2: Examine the pre-filled data for Knorr-Bremse Aktiengesellschaft (0KBIL) including historical and forecasted figures.
- Step 3: Modify the key assumptions (highlighted in yellow) based on your insights.
- Step 4: Observe the automatic recalculations of Knorr-Bremse Aktiengesellschaft’s intrinsic value.
- Step 5: Utilize the results for your investment choices or reporting needs.
Why Choose Knorr-Bremse (0KBIL)?
- Save Time: Skip the hassle of building complex models – our solutions are ready to go.
- Enhance Accuracy: Dependable financial data and calculations minimize valuation errors.
- Completely Customizable: Adjust the models to align with your specific assumptions and forecasts.
- Intuitive Insights: User-friendly charts and outputs simplify result analysis.
- Endorsed by Professionals: Crafted for experts who prioritize accuracy and efficiency.
Who Can Benefit from This Product?
- Investors: Assess Knorr-Bremse's valuation prior to buying or selling shares.
- CFOs and Financial Analysts: Optimize valuation workflows and evaluate financial forecasts.
- Startup Founders: Understand the valuation methods used for major companies like Knorr-Bremse (0KBIL).
- Consultants: Provide clients with detailed and professional valuation reports.
- Students and Educators: Utilize real-time data to practice and teach valuation strategies.
What the Template Contains
- Historical Data: Contains Knorr-Bremse’s previous financial records and foundational forecasts.
- DCF and Levered DCF Models: Comprehensive templates for calculating Knorr-Bremse's intrinsic value.
- WACC Sheet: Pre-configured calculations for Weighted Average Cost of Capital.
- Editable Inputs: Adjust critical drivers such as growth rates, EBITDA %, and CAPEX assumptions.
- Quarterly and Annual Statements: An extensive overview of Knorr-Bremse’s financial performance.
- Interactive Dashboard: Dynamically visualize valuation outcomes and forecasts.
Disclaimer
All information, articles, and product details provided on this website are for general informational and educational purposes only. We do not claim any ownership over, nor do we intend to infringe upon, any trademarks, copyrights, logos, brand names, or other intellectual property mentioned or depicted on this site. Such intellectual property remains the property of its respective owners, and any references here are made solely for identification or informational purposes, without implying any affiliation, endorsement, or partnership.
We make no representations or warranties, express or implied, regarding the accuracy, completeness, or suitability of any content or products presented. Nothing on this website should be construed as legal, tax, investment, financial, medical, or other professional advice. In addition, no part of this site—including articles or product references—constitutes a solicitation, recommendation, endorsement, advertisement, or offer to buy or sell any securities, franchises, or other financial instruments, particularly in jurisdictions where such activity would be unlawful.
All content is of a general nature and may not address the specific circumstances of any individual or entity. It is not a substitute for professional advice or services. Any actions you take based on the information provided here are strictly at your own risk. You accept full responsibility for any decisions or outcomes arising from your use of this website and agree to release us from any liability in connection with your use of, or reliance upon, the content or products found herein.