
|
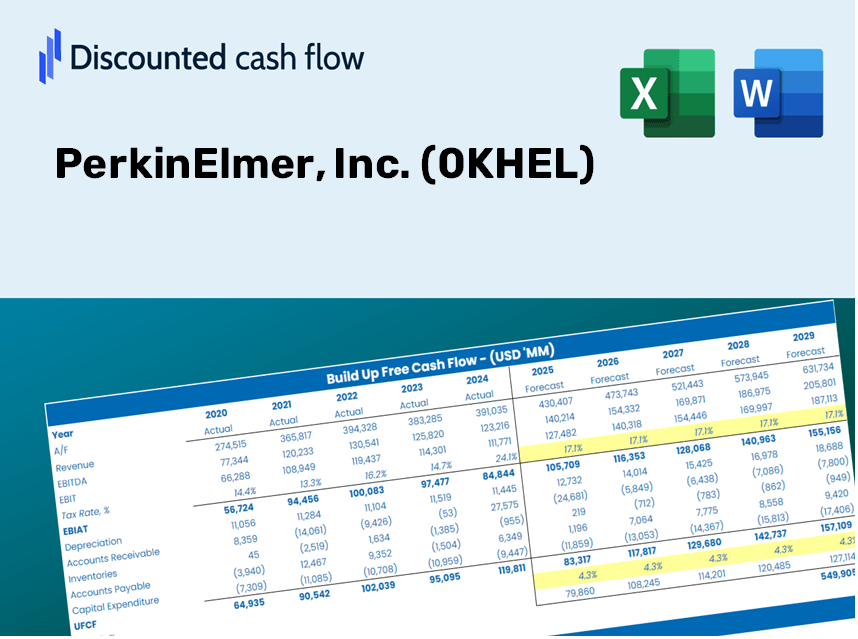
PerkinElmer, Inc. (0KHE.L) DCF Valuation |
Fully Editable: Tailor To Your Needs In Excel Or Sheets
Professional Design: Trusted, Industry-Standard Templates
Investor-Approved Valuation Models
MAC/PC Compatible, Fully Unlocked
No Expertise Is Needed; Easy To Follow
Revvity, Inc. (0KHE.L) Bundle
Looking to evaluate PerkinElmer, Inc.'s intrinsic value? Our (0KHEL) DCF Calculator integrates real-world data with extensive customization features, enabling you to refine your forecasts and enhance your investment choices.
Discounted Cash Flow (DCF) - (USD MM)
| Year | AY1 2020 |
AY2 2021 |
AY3 2022 |
AY4 2023 |
AY5 2024 |
FY1 2025 |
FY2 2026 |
FY3 2027 |
FY4 2028 |
FY5 2029 |
|---|---|---|---|---|---|---|---|---|---|---|
| Revenue | 2,663.2 | 3,827.8 | 3,311.8 | 2,750.6 | 2,755.0 | 2,847.8 | 2,943.6 | 3,042.7 | 3,145.1 | 3,250.9 |
| Revenue Growth, % | 0 | 43.73 | -13.48 | -16.95 | 0.16197 | 3.37 | 3.37 | 3.37 | 3.37 | 3.37 |
| EBITDA | 1,202.6 | 1,726.6 | 1,300.2 | 713.6 | 840.3 | 1,059.1 | 1,094.8 | 1,131.6 | 1,169.7 | 1,209.1 |
| EBITDA, % | 45.16 | 45.11 | 39.26 | 25.94 | 30.5 | 37.19 | 37.19 | 37.19 | 37.19 | 37.19 |
| Depreciation | 246.5 | 311.4 | 427.0 | 431.8 | 427.8 | 350.3 | 362.1 | 374.3 | 386.9 | 399.9 |
| Depreciation, % | 9.26 | 8.14 | 12.89 | 15.7 | 15.53 | 12.3 | 12.3 | 12.3 | 12.3 | 12.3 |
| EBIT | 956.1 | 1,415.1 | 873.2 | 281.8 | 412.4 | 708.8 | 732.7 | 757.3 | 782.8 | 809.2 |
| EBIT, % | 35.9 | 36.97 | 26.37 | 10.24 | 14.97 | 24.89 | 24.89 | 24.89 | 24.89 | 24.89 |
| Total Cash | 402.0 | 603.3 | 454.4 | 1,603.1 | 1,163.4 | 826.3 | 854.2 | 882.9 | 912.6 | 943.3 |
| Total Cash, percent | .0 | .0 | .0 | .0 | .0 | .0 | .0 | .0 | .0 | .0 |
| Account Receivables | 1,155.1 | 707.9 | 612.8 | 632.8 | 632.4 | 719.5 | 743.7 | 768.8 | 794.6 | 821.4 |
| Account Receivables, % | 43.37 | 18.49 | 18.5 | 23.01 | 22.95 | 25.27 | 25.27 | 25.27 | 25.27 | 25.27 |
| Inventories | 514.6 | 624.7 | 405.5 | 428.1 | 367.6 | 437.4 | 452.1 | 467.3 | 483.0 | 499.3 |
| Inventories, % | 19.32 | 16.32 | 12.24 | 15.56 | 13.34 | 15.36 | 15.36 | 15.36 | 15.36 | 15.36 |
| Accounts Payable | 327.3 | 324.8 | 272.8 | 204.1 | 167.5 | 242.1 | 250.3 | 258.7 | 267.4 | 276.4 |
| Accounts Payable, % | 12.29 | 8.49 | 8.24 | 7.42 | 6.08 | 8.5 | 8.5 | 8.5 | 8.5 | 8.5 |
| Capital Expenditure | -77.5 | -99.9 | -85.6 | -81.4 | -86.6 | -80.9 | -83.6 | -86.5 | -89.4 | -92.4 |
| Capital Expenditure, % | -2.91 | -2.61 | -2.59 | -2.96 | -3.15 | -2.84 | -2.84 | -2.84 | -2.84 | -2.84 |
| Tax Rate, % | 14.47 | 14.47 | 14.47 | 14.47 | 14.47 | 14.47 | 14.47 | 14.47 | 14.47 | 14.47 |
| EBITAT | 869.8 | 1,108.9 | 762.4 | 1,067.4 | 352.7 | 626.8 | 647.9 | 669.8 | 692.3 | 715.6 |
| Depreciation | ||||||||||
| Changes in Account Receivables | ||||||||||
| Changes in Inventories | ||||||||||
| Changes in Accounts Payable | ||||||||||
| Capital Expenditure | ||||||||||
| UFCF | -303.5 | 1,655.0 | 1,366.2 | 1,306.5 | 718.2 | 814.1 | 895.6 | 925.8 | 957.0 | 989.2 |
| WACC, % | 7.25 | 7.15 | 7.22 | 7.33 | 7.21 | 7.23 | 7.23 | 7.23 | 7.23 | 7.23 |
| PV UFCF | ||||||||||
| SUM PV UFCF | 3,710.1 | |||||||||
| Long Term Growth Rate, % | 2.00 | |||||||||
| Free cash flow (T + 1) | 1,009 | |||||||||
| Terminal Value | 19,278 | |||||||||
| Present Terminal Value | 13,596 | |||||||||
| Enterprise Value | 17,306 | |||||||||
| Net Debt | 2,139 | |||||||||
| Equity Value | 15,167 | |||||||||
| Diluted Shares Outstanding, MM | 123 | |||||||||
| Equity Value Per Share | 123.49 |
Benefits of Choosing Us
- Comprehensive Financial Model: Leverage PerkinElmer's actual data for accurate DCF valuation.
- Full Control Over Forecasting: Modify revenue growth, profit margins, WACC, and other critical variables.
- Real-Time Calculations: Automatic updates provide immediate insights as you adjust inputs.
- Professional-Grade Template: An advanced Excel file crafted for high-quality valuation presentations.
- Flexible and Reusable: Designed for adaptability, allowing you to conduct detailed forecasts repeatedly.
Key Features
- Pre-Loaded Data: PerkinElmer, Inc.'s historical financial statements and pre-populated forecasts.
- Customizable Inputs: Modify WACC, tax rates, revenue growth, and EBITDA margins as needed.
- Real-Time Results: Instantly view the recalculated intrinsic value for PerkinElmer, Inc. (0KHEL).
- Clear Visual Outputs: Engaging dashboard charts showcasing valuation results and essential metrics.
- Designed for Precision: A professional-grade tool tailored for analysts, investors, and finance professionals.
How It Works
- Step 1: Download the ready-to-use Excel template containing PerkinElmer, Inc.'s (0KHEL) data.
- Step 2: Review the pre-populated sheets to familiarize yourself with the essential metrics.
- Step 3: Modify forecasts and assumptions in the editable yellow cells (WACC, growth rates, and profit margins).
- Step 4: Instantly see the updated results, including the intrinsic value of PerkinElmer, Inc. (0KHEL).
- Step 5: Utilize the outputs to make well-informed investment decisions or create detailed reports.
Why Choose PerkinElmer's Solutions?
- Streamlined Workflow: No need to build a model from the ground up – our tools are ready to go.
- Enhanced Precision: Dependable data and methodologies minimize errors in your analysis.
- Fully Adaptable: Customize our platform to align with your specific needs and forecasts.
- User-Friendly Interface: Intuitive visuals and outputs facilitate easy interpretation of results.
- Backed by Professionals: Developed for experts who prioritize accuracy and efficiency.
Who Should Utilize This Product?
- Professional Investors: Develop comprehensive and trustworthy valuation models for investment portfolio evaluations.
- Corporate Finance Teams: Examine valuation scenarios to inform and shape corporate strategy.
- Consultants and Advisors: Deliver precise valuation insights for PerkinElmer, Inc. (0KHEL) to your clients.
- Students and Educators: Leverage real-world data for practice and instruction in financial modeling.
- Life Science Enthusiasts: Gain insights into how companies like PerkinElmer, Inc. (0KHEL) are assessed in the marketplace.
Overview of Template Components
- Historical Data: Provides a comprehensive overview of PerkinElmer’s past financial performance and foundational forecasts.
- DCF and Levered DCF Models: In-depth templates for assessing the intrinsic value of PerkinElmer.
- WACC Sheet: Pre-configured calculations for Weighted Average Cost of Capital.
- Editable Inputs: Adjust essential parameters such as growth rates, EBITDA percentages, and CAPEX projections.
- Quarterly and Annual Statements: A thorough analysis of PerkinElmer’s financial reports.
- Interactive Dashboard: Dynamic visualization of valuation outcomes and forecasts.
Disclaimer
All information, articles, and product details provided on this website are for general informational and educational purposes only. We do not claim any ownership over, nor do we intend to infringe upon, any trademarks, copyrights, logos, brand names, or other intellectual property mentioned or depicted on this site. Such intellectual property remains the property of its respective owners, and any references here are made solely for identification or informational purposes, without implying any affiliation, endorsement, or partnership.
We make no representations or warranties, express or implied, regarding the accuracy, completeness, or suitability of any content or products presented. Nothing on this website should be construed as legal, tax, investment, financial, medical, or other professional advice. In addition, no part of this site—including articles or product references—constitutes a solicitation, recommendation, endorsement, advertisement, or offer to buy or sell any securities, franchises, or other financial instruments, particularly in jurisdictions where such activity would be unlawful.
All content is of a general nature and may not address the specific circumstances of any individual or entity. It is not a substitute for professional advice or services. Any actions you take based on the information provided here are strictly at your own risk. You accept full responsibility for any decisions or outcomes arising from your use of this website and agree to release us from any liability in connection with your use of, or reliance upon, the content or products found herein.