
|
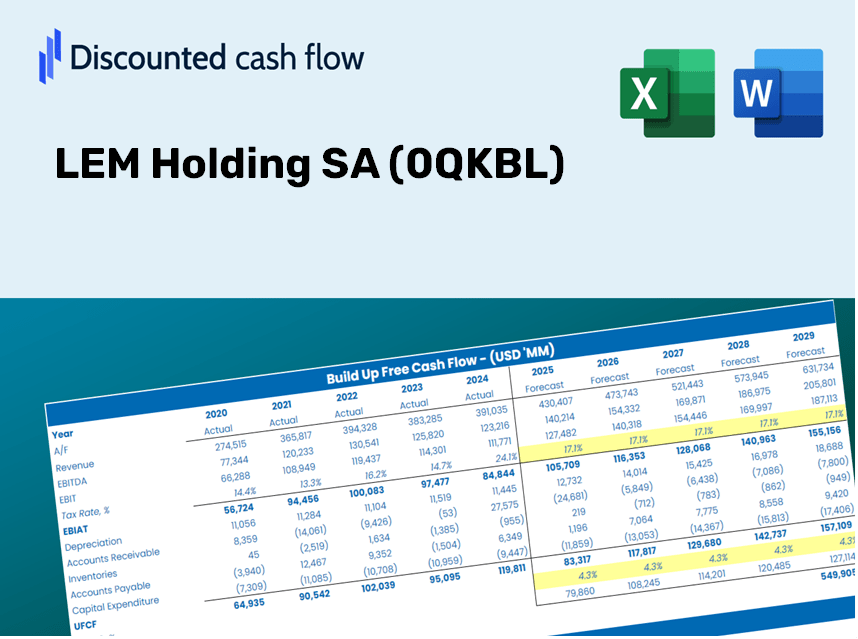
LEM Holding SA (0QKB.L) DCF Valuation |
Fully Editable: Tailor To Your Needs In Excel Or Sheets
Professional Design: Trusted, Industry-Standard Templates
Investor-Approved Valuation Models
MAC/PC Compatible, Fully Unlocked
No Expertise Is Needed; Easy To Follow
LEM Holding SA (0QKB.L) Bundle
Looking to assess the intrinsic value of LEM Holding SA? Our (0QKBL) DCF Calculator integrates real-world data with extensive customization features, allowing you to refine your forecasts and enhance your investment strategies.
Discounted Cash Flow (DCF) - (USD MM)
| Year | AY1 2020 |
AY2 2021 |
AY3 2022 |
AY4 2023 |
AY5 2024 |
FY1 2025 |
FY2 2026 |
FY3 2027 |
FY4 2028 |
FY5 2029 |
|---|---|---|---|---|---|---|---|---|---|---|
| Revenue | 301.0 | 373.4 | 406.4 | 405.8 | 306.9 | 313.4 | 319.9 | 326.6 | 333.5 | 340.5 |
| Revenue Growth, % | 0 | 24.07 | 8.83 | -0.14101 | -24.36 | 2.1 | 2.1 | 2.1 | 2.1 | 2.1 |
| EBITDA | 73.4 | 103.3 | 107.0 | 93.6 | 34.2 | 70.6 | 72.1 | 73.6 | 75.1 | 76.7 |
| EBITDA, % | 24.4 | 27.68 | 26.33 | 23.08 | 11.13 | 22.52 | 22.52 | 22.52 | 22.52 | 22.52 |
| Depreciation | 13.7 | 15.1 | 14.6 | 15.8 | 19.0 | 14.0 | 14.3 | 14.6 | 14.9 | 15.2 |
| Depreciation, % | 4.57 | 4.06 | 3.59 | 3.88 | 6.2 | 4.46 | 4.46 | 4.46 | 4.46 | 4.46 |
| EBIT | 59.7 | 88.2 | 92.4 | 77.9 | 15.1 | 56.6 | 57.8 | 59.0 | 60.2 | 61.5 |
| EBIT, % | 19.84 | 23.62 | 22.74 | 19.2 | 4.93 | 18.06 | 18.06 | 18.06 | 18.06 | 18.06 |
| Total Cash | 22.4 | 17.2 | 21.8 | 23.7 | 18.7 | 18.4 | 18.8 | 19.2 | 19.6 | 20.0 |
| Total Cash, percent | .0 | .0 | .0 | .0 | .0 | .0 | .0 | .0 | .0 | .0 |
| Account Receivables | 66.4 | 81.9 | 88.4 | 78.9 | 70.2 | 67.7 | 69.2 | 70.6 | 72.1 | 73.6 |
| Account Receivables, % | 22.06 | 21.93 | 21.76 | 19.45 | 22.88 | 21.61 | 21.61 | 21.61 | 21.61 | 21.61 |
| Inventories | 43.0 | 50.8 | 59.5 | 56.4 | 57.6 | 47.1 | 48.1 | 49.1 | 50.2 | 51.2 |
| Inventories, % | 14.27 | 13.61 | 14.65 | 13.89 | 18.78 | 15.04 | 15.04 | 15.04 | 15.04 | 15.04 |
| Accounts Payable | 22.5 | 23.3 | 33.0 | 24.9 | 29.2 | 23.5 | 24.0 | 24.5 | 25.0 | 25.5 |
| Accounts Payable, % | 7.48 | 6.25 | 8.12 | 6.14 | 9.53 | 7.5 | 7.5 | 7.5 | 7.5 | 7.5 |
| Capital Expenditure | -13.9 | -21.5 | -26.4 | -29.2 | -15.6 | -18.3 | -18.6 | -19.0 | -19.4 | -19.8 |
| Capital Expenditure, % | -4.62 | -5.76 | -6.49 | -7.18 | -5.07 | -5.83 | -5.83 | -5.83 | -5.83 | -5.83 |
| Tax Rate, % | 19.9 | 19.9 | 19.9 | 19.9 | 19.9 | 19.9 | 19.9 | 19.9 | 19.9 | 19.9 |
| EBITAT | 54.5 | 74.8 | 78.3 | 67.9 | 12.1 | 48.5 | 49.5 | 50.5 | 51.6 | 52.7 |
| Depreciation | ||||||||||
| Changes in Account Receivables | ||||||||||
| Changes in Inventories | ||||||||||
| Changes in Accounts Payable | ||||||||||
| Capital Expenditure | ||||||||||
| UFCF | -32.5 | 45.9 | 60.9 | 59.0 | 27.3 | 51.4 | 43.2 | 44.1 | 45.0 | 46.0 |
| WACC, % | 6.3 | 6.25 | 6.25 | 6.27 | 6.22 | 6.26 | 6.26 | 6.26 | 6.26 | 6.26 |
| PV UFCF | ||||||||||
| SUM PV UFCF | 192.7 | |||||||||
| Long Term Growth Rate, % | 2.00 | |||||||||
| Free cash flow (T + 1) | 47 | |||||||||
| Terminal Value | 1,102 | |||||||||
| Present Terminal Value | 813 | |||||||||
| Enterprise Value | 1,006 | |||||||||
| Net Debt | 124 | |||||||||
| Equity Value | 882 | |||||||||
| Diluted Shares Outstanding, MM | 1 | |||||||||
| Equity Value Per Share | 772.16 |
What You Will Receive
- Customizable Excel Template: A fully adjustable Excel-based DCF Calculator featuring pre-populated financial data for LEM Holding SA (0QKBL).
- Accurate Data: Access to historical figures and forward-looking projections (highlighted in the yellow cells).
- Flexible Forecasting: Modify key assumptions such as revenue growth, EBITDA %, and WACC.
- Instant Calculations: Quickly observe how changes in your inputs affect LEM Holding SA’s (0QKBL) valuation.
- Professional Resource: Designed for use by investors, CFOs, consultants, and financial analysts.
- Intuitive Layout: Organized for simplicity and ease of navigation, complete with step-by-step guidance.
Key Features
- Real-Life LEM Holding Data: Comes pre-loaded with LEM Holding SA's historical financial data and future projections.
- Completely Customizable Inputs: Modify revenue growth rates, profit margins, WACC, tax rates, and capital expenditure values.
- Interactive Valuation Model: Automatically refreshes Net Present Value (NPV) and intrinsic value based on your specified inputs.
- Scenario Analysis: Develop multiple forecasting scenarios to explore various valuation results.
- User-Friendly Interface: Designed to be intuitive and accessible for both professionals and novices.
How It Works
- Step 1: Download the Excel file for LEM Holding SA (0QKBL).
- Step 2: Examine the pre-filled financial data and forecasts provided for LEM Holding SA (0QKBL).
- Step 3: Adjust key variables such as revenue growth, WACC, and tax rates (highlighted cells) to reflect your assumptions.
- Step 4: Observe the DCF model update in real-time as you make changes to the inputs.
- Step 5: Review the output data and leverage the insights for your investment strategies.
Why Choose This Calculator?
- Accurate Data: Up-to-date LEM Holding SA (0QKBL) financials provide dependable valuation results.
- Customizable: Tailor key inputs such as growth rates, WACC, and tax rates to fit your forecasts.
- Time-Saving: Pre-existing calculations save you the hassle of building from the ground up.
- Professional-Grade Tool: Created for use by investors, analysts, and consultants alike.
- User-Friendly: With its straightforward layout and guided instructions, it's accessible for all users.
Who Should Benefit from LEM Holding SA (0QKBL)?
- Individual Investors: Make informed choices regarding the purchase or sale of LEM Holding SA (0QKBL) shares.
- Financial Analysts: Enhance valuation processes with accessible financial models tailored for LEM Holding SA (0QKBL).
- Consultants: Provide clients with swift and precise valuation insights specific to LEM Holding SA (0QKBL).
- Business Owners: Gain a deeper understanding of how large companies like LEM Holding SA (0QKBL) are valued to inform your own business strategy.
- Finance Students: Master valuation techniques by analyzing real-world data and scenarios related to LEM Holding SA (0QKBL).
Contents of the Template
- Historical Data: Offers LEM Holding SA’s previous financial reports and foundational forecasts.
- DCF and Levered DCF Models: Comprehensive templates to assess the intrinsic value of LEM Holding SA.
- WACC Sheet: Pre-constructed calculations for Weighted Average Cost of Capital.
- Editable Inputs: Adjust essential drivers such as growth rates, EBITDA %, and CAPEX estimates.
- Quarterly and Annual Statements: A thorough analysis of LEM Holding SA’s financial performance.
- Interactive Dashboard: Visualize valuation outcomes and projections in real-time.
Disclaimer
All information, articles, and product details provided on this website are for general informational and educational purposes only. We do not claim any ownership over, nor do we intend to infringe upon, any trademarks, copyrights, logos, brand names, or other intellectual property mentioned or depicted on this site. Such intellectual property remains the property of its respective owners, and any references here are made solely for identification or informational purposes, without implying any affiliation, endorsement, or partnership.
We make no representations or warranties, express or implied, regarding the accuracy, completeness, or suitability of any content or products presented. Nothing on this website should be construed as legal, tax, investment, financial, medical, or other professional advice. In addition, no part of this site—including articles or product references—constitutes a solicitation, recommendation, endorsement, advertisement, or offer to buy or sell any securities, franchises, or other financial instruments, particularly in jurisdictions where such activity would be unlawful.
All content is of a general nature and may not address the specific circumstances of any individual or entity. It is not a substitute for professional advice or services. Any actions you take based on the information provided here are strictly at your own risk. You accept full responsibility for any decisions or outcomes arising from your use of this website and agree to release us from any liability in connection with your use of, or reliance upon, the content or products found herein.