
|
Compagnie Financière Tradition SA (0QL7.L) DCF Valuation |
Fully Editable: Tailor To Your Needs In Excel Or Sheets
Professional Design: Trusted, Industry-Standard Templates
Investor-Approved Valuation Models
MAC/PC Compatible, Fully Unlocked
No Expertise Is Needed; Easy To Follow
Compagnie Financière Tradition SA (0QL7.L) Bundle
Engineered for accuracy, our (0QL7L) DCF Calculator enables you to evaluate Compagnie Financière Tradition SA's valuation using genuine financial data while providing complete flexibility to modify all essential parameters for enhanced projections.
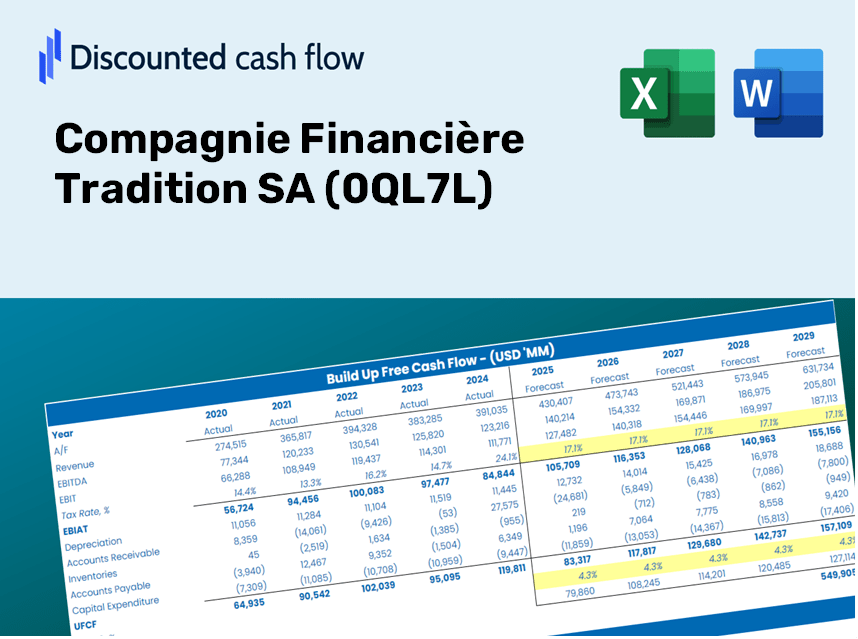
Discounted Cash Flow (DCF) - (USD MM)
| Year | AY1 2020 |
AY2 2021 |
AY3 2022 |
AY4 2023 |
AY5 2024 |
FY1 2025 |
FY2 2026 |
FY3 2027 |
FY4 2028 |
FY5 2029 |
|---|---|---|---|---|---|---|---|---|---|---|
| Revenue | 905.4 | 875.6 | 964.9 | 983.3 | 1,043.9 | 1,083.0 | 1,123.6 | 1,165.7 | 1,209.4 | 1,254.6 |
| Revenue Growth, % | 0 | -3.29 | 10.2 | 1.91 | 6.17 | 3.75 | 3.75 | 3.75 | 3.75 | 3.75 |
| EBITDA | 112.5 | 86.7 | 120.7 | 128.6 | 148.7 | 134.6 | 139.7 | 144.9 | 150.3 | 156.0 |
| EBITDA, % | 12.42 | 9.9 | 12.51 | 13.08 | 14.24 | 12.43 | 12.43 | 12.43 | 12.43 | 12.43 |
| Depreciation | 28.6 | 26.7 | 26.6 | 23.1 | 23.3 | 29.3 | 30.4 | 31.6 | 32.8 | 34.0 |
| Depreciation, % | 3.15 | 3.05 | 2.75 | 2.35 | 2.24 | 2.71 | 2.71 | 2.71 | 2.71 | 2.71 |
| EBIT | 83.9 | 60.0 | 94.2 | 105.5 | 125.3 | 105.3 | 109.2 | 113.3 | 117.6 | 122.0 |
| EBIT, % | 9.27 | 6.85 | 9.76 | 10.73 | 12.01 | 9.72 | 9.72 | 9.72 | 9.72 | 9.72 |
| Total Cash | 319.3 | 391.0 | 334.1 | 353.6 | 493.1 | 428.3 | 444.4 | 461.0 | 478.3 | 496.2 |
| Total Cash, percent | .0 | .0 | .0 | .0 | .0 | .0 | .0 | .0 | .0 | .0 |
| Account Receivables | 480.8 | 857.5 | 403.3 | 324.8 | 487.1 | 590.3 | 612.4 | 635.4 | 659.2 | 683.8 |
| Account Receivables, % | 53.1 | 97.93 | 41.8 | 33.03 | 46.66 | 54.51 | 54.51 | 54.51 | 54.51 | 54.51 |
| Inventories | .0 | .0 | .0 | .0 | .0 | .0 | .0 | .0 | .0 | .0 |
| Inventories, % | 0 | 0 | 0 | 0 | 0 | 0 | 0 | 0 | 0 | 0 |
| Accounts Payable | .0 | .0 | .0 | .0 | .0 | .0 | .0 | .0 | .0 | .0 |
| Accounts Payable, % | 0 | 0 | 0 | 0 | 0 | 0 | 0 | 0 | 0 | 0 |
| Capital Expenditure | -8.6 | -6.5 | -5.8 | -4.1 | -4.2 | -6.7 | -7.0 | -7.3 | -7.5 | -7.8 |
| Capital Expenditure, % | -0.94532 | -0.74473 | -0.59994 | -0.42174 | -0.3981 | -0.62197 | -0.62197 | -0.62197 | -0.62197 | -0.62197 |
| Tax Rate, % | 24.69 | 24.69 | 24.69 | 24.69 | 24.69 | 24.69 | 24.69 | 24.69 | 24.69 | 24.69 |
| EBITAT | 68.5 | 46.0 | 69.9 | 78.3 | 94.4 | 80.5 | 83.5 | 86.6 | 89.9 | 93.2 |
| Depreciation | ||||||||||
| Changes in Account Receivables | ||||||||||
| Changes in Inventories | ||||||||||
| Changes in Accounts Payable | ||||||||||
| Capital Expenditure | ||||||||||
| UFCF | -392.3 | -310.4 | 544.8 | 175.8 | -48.7 | -.1 | 84.8 | 88.0 | 91.3 | 94.7 |
| WACC, % | 4.32 | 4.3 | 4.29 | 4.29 | 4.29 | 4.3 | 4.3 | 4.3 | 4.3 | 4.3 |
| PV UFCF | ||||||||||
| SUM PV UFCF | 309.4 | |||||||||
| Long Term Growth Rate, % | 2.00 | |||||||||
| Free cash flow (T + 1) | 97 | |||||||||
| Terminal Value | 4,203 | |||||||||
| Present Terminal Value | 3,406 | |||||||||
| Enterprise Value | 3,715 | |||||||||
| Net Debt | -44 | |||||||||
| Equity Value | 3,759 | |||||||||
| Diluted Shares Outstanding, MM | 8 | |||||||||
| Equity Value Per Share | 468.34 |
What You Will Receive
- Accurate CFT Financial Data: Pre-loaded with Compagnie Financière Tradition SA’s historical and forecasted figures for detailed analysis.
- Completely Customizable Template: Easily adjust vital inputs such as revenue growth, WACC, and EBITDA percentage.
- Instant Calculations: Observe updates to Compagnie Financière Tradition SA’s intrinsic value in real-time as you make adjustments.
- Professional Valuation Solution: Tailored for investors, analysts, and consultants aiming for precise DCF results.
- Intuitive Layout: User-friendly design with straightforward instructions suitable for all skill levels.
Key Features
- 🔍 Real-Life CFT Financials: Pre-filled historical and projected data for Compagnie Financière Tradition SA (0QL7L).
- ✏️ Fully Customizable Inputs: Adjust all key parameters (yellow cells) such as WACC, growth %, and tax rates.
- 📊 Professional DCF Valuation: Built-in formulas compute the intrinsic value of Compagnie Financière Tradition SA (0QL7L) using the Discounted Cash Flow method.
- ⚡ Instant Results: Visualize the valuation of Compagnie Financière Tradition SA (0QL7L) immediately after making adjustments.
- Scenario Analysis: Evaluate and compare different outcomes based on various financial assumptions side-by-side.
How It Functions
- Obtain the Template: Quickly access the Excel-based CFT DCF Calculator for Compagnie Financière Tradition SA (0QL7L).
- Enter Your Assumptions: Modify the yellow-highlighted cells to set growth rates, WACC, margins, and additional parameters.
- Real-Time Calculations: The model instantly recalculates the intrinsic value of Compagnie Financière Tradition SA (0QL7L).
- Explore Scenarios: Test various assumptions to assess potential changes in valuation.
- Evaluate and Decide: Utilize the findings to inform your investment or financial evaluations.
Why Choose This Calculator for Compagnie Financière Tradition SA (0QL7L)?
- All-in-One Tool: Integrates DCF, WACC, and financial ratio analyses for a comprehensive evaluation.
- Flexible Input Options: Modify the yellow-highlighted fields to explore different scenarios and outcomes.
- In-Depth Analysis: Automatically determines the intrinsic value and Net Present Value for Compagnie Financière Tradition SA (0QL7L).
- Preloaded Financial Data: Historical and projected data provide reliable starting points for your calculations.
- High-Quality Standard: Perfect for financial analysts, investors, and business consultants seeking professional-grade insights.
Who Can Benefit from Compagnie Financière Tradition SA (0QL7L)?
- Investors: Utilize a top-tier valuation tool to make informed investment choices.
- Financial Analysts: Enhance efficiency with a customizable DCF model designed for swift analysis.
- Consultants: Seamlessly modify the template for client reports or presentations.
- Finance Enthusiasts: Expand your knowledge of valuation methods with practical, real-world applications.
- Educators and Students: Leverage this resource as a hands-on learning aid in finance courses.
Contents of the Template
- Comprehensive DCF Model: An editable template featuring detailed valuation calculations.
- Real-World Data: Compagnie Financière Tradition SA’s historical and projected financials preloaded for in-depth analysis.
- Customizable Parameters: Modify WACC, growth rates, and tax assumptions to explore various scenarios.
- Financial Statements: Complete breakdowns of annual and quarterly data for enhanced insights.
- Key Ratios: Integrated analysis covering profitability, efficiency, and leverage metrics.
- Dashboard with Visual Outputs: Charts and tables designed to present clear, actionable results.
Disclaimer
All information, articles, and product details provided on this website are for general informational and educational purposes only. We do not claim any ownership over, nor do we intend to infringe upon, any trademarks, copyrights, logos, brand names, or other intellectual property mentioned or depicted on this site. Such intellectual property remains the property of its respective owners, and any references here are made solely for identification or informational purposes, without implying any affiliation, endorsement, or partnership.
We make no representations or warranties, express or implied, regarding the accuracy, completeness, or suitability of any content or products presented. Nothing on this website should be construed as legal, tax, investment, financial, medical, or other professional advice. In addition, no part of this site—including articles or product references—constitutes a solicitation, recommendation, endorsement, advertisement, or offer to buy or sell any securities, franchises, or other financial instruments, particularly in jurisdictions where such activity would be unlawful.
All content is of a general nature and may not address the specific circumstances of any individual or entity. It is not a substitute for professional advice or services. Any actions you take based on the information provided here are strictly at your own risk. You accept full responsibility for any decisions or outcomes arising from your use of this website and agree to release us from any liability in connection with your use of, or reliance upon, the content or products found herein.