
|
Tecan Group AG (0QLN.L) DCF Valuation |
Fully Editable: Tailor To Your Needs In Excel Or Sheets
Professional Design: Trusted, Industry-Standard Templates
Investor-Approved Valuation Models
MAC/PC Compatible, Fully Unlocked
No Expertise Is Needed; Easy To Follow
Tecan Group AG (0QLN.L) Bundle
Whether you’re an investor or analyst, this (0QLNL) DCF Calculator is your go-to tool for accurate valuation. Equipped with real data from Tecan Group AG, you can adjust forecasts and immediately observe the effects.
Benefits You Will Receive
- Customizable Excel Template: A fully adaptable Excel-based DCF Calculator featuring pre-filled financial data for Tecan Group AG (0QLNL).
- Authentic Data: Access to historical figures and future projections (indicated in the highlighted cells).
- Adjustable Forecast: Modify key assumptions such as revenue growth, EBITDA percentage, and WACC.
- Instant Calculations: Quickly observe how your inputs affect Tecan's valuation.
- Professional Resource: Designed for investors, CFOs, consultants, and financial analysts.
- Intuitive Layout: Organized for ease of understanding and use, complete with step-by-step guidance.
Key Features
- Comprehensive Tecan Data: Includes Tecan Group AG’s historical financial performance along with future projections.
- Customizable Assumptions: Modify revenue growth rates, profit margins, discount rates, tax liabilities, and capital expenditures to suit your analysis.
- Interactive Valuation Model: Automatically recalculates Net Present Value (NPV) and intrinsic value based on your customized inputs.
- Multiple Scenario Analysis: Develop various forecasting scenarios to evaluate different valuation results.
- Intuitive User Interface: Designed for ease of use, catering to both experienced professionals and newcomers.
How It Works
- Step 1: Download the Excel file.
- Step 2: Review Tecan Group AG’s pre-filled financial data and forecasts.
- Step 3: Adjust key inputs such as revenue growth, WACC, and tax rates (highlighted cells).
- Step 4: Observe the DCF model update in real-time as you modify assumptions.
- Step 5: Evaluate the outputs and utilize the findings for your investment decisions regarding Tecan Group AG (0QLNL).
Why Opt for This Calculator?
- Designed for Experts: A sophisticated tool favored by analysts, CFOs, and consultants.
- Accurate Financials: Tecan Group AG’s historical and projected financial data preloaded for precision.
- Flexible Scenario Testing: Effortlessly simulate various forecasts and assumptions.
- Comprehensive Outputs: Automatically calculates intrinsic value, NPV, and essential metrics.
- User-Friendly: Detailed step-by-step instructions to assist you throughout the process.
Who Can Benefit from This Product?
- Investors: Evaluate Tecan Group AG’s (0QLNL) valuation prior to making investment decisions.
- CFOs and Financial Analysts: Enhance valuation methodologies and validate forecasts for Tecan Group AG (0QLNL).
- Startup Founders: Discover how established companies like Tecan Group AG (0QLNL) are appraised in the market.
- Consultants: Create comprehensive valuation reports tailored for clients focusing on Tecan Group AG (0QLNL).
- Students and Educators: Utilize real market data from Tecan Group AG (0QLNL) to practice and teach valuation strategies.
Contents of the Template
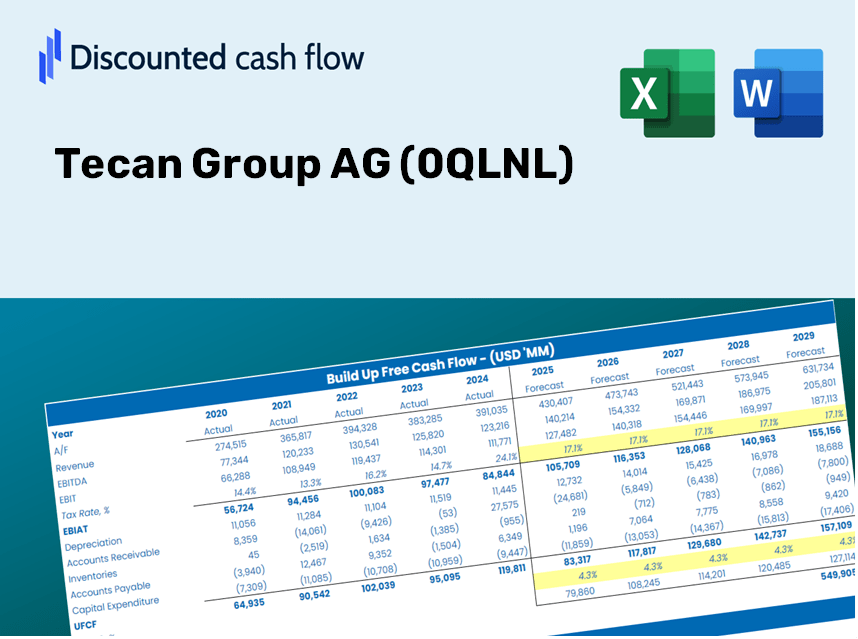
- Operating and Balance Sheet Data: Pre-filled historical data and projections for Tecan Group AG (0QLNL), including metrics such as revenue, EBITDA, EBIT, and capital expenditures.
- WACC Calculation: A specific sheet dedicated to the calculation of Weighted Average Cost of Capital (WACC), featuring key parameters like Beta, risk-free rate, and share price.
- DCF Valuation (Unlevered and Levered): Customizable Discounted Cash Flow models that provide intrinsic value along with detailed calculations.
- Financial Statements: Pre-loaded financial statements (both annual and quarterly) to facilitate thorough analysis.
- Key Ratios: A comprehensive list of profitability, leverage, and efficiency ratios specifically for Tecan Group AG (0QLNL).
- Dashboard and Charts: A visual overview of valuation outputs and assumptions, designed for easy analysis of results.
Disclaimer
All information, articles, and product details provided on this website are for general informational and educational purposes only. We do not claim any ownership over, nor do we intend to infringe upon, any trademarks, copyrights, logos, brand names, or other intellectual property mentioned or depicted on this site. Such intellectual property remains the property of its respective owners, and any references here are made solely for identification or informational purposes, without implying any affiliation, endorsement, or partnership.
We make no representations or warranties, express or implied, regarding the accuracy, completeness, or suitability of any content or products presented. Nothing on this website should be construed as legal, tax, investment, financial, medical, or other professional advice. In addition, no part of this site—including articles or product references—constitutes a solicitation, recommendation, endorsement, advertisement, or offer to buy or sell any securities, franchises, or other financial instruments, particularly in jurisdictions where such activity would be unlawful.
All content is of a general nature and may not address the specific circumstances of any individual or entity. It is not a substitute for professional advice or services. Any actions you take based on the information provided here are strictly at your own risk. You accept full responsibility for any decisions or outcomes arising from your use of this website and agree to release us from any liability in connection with your use of, or reliance upon, the content or products found herein.