
|
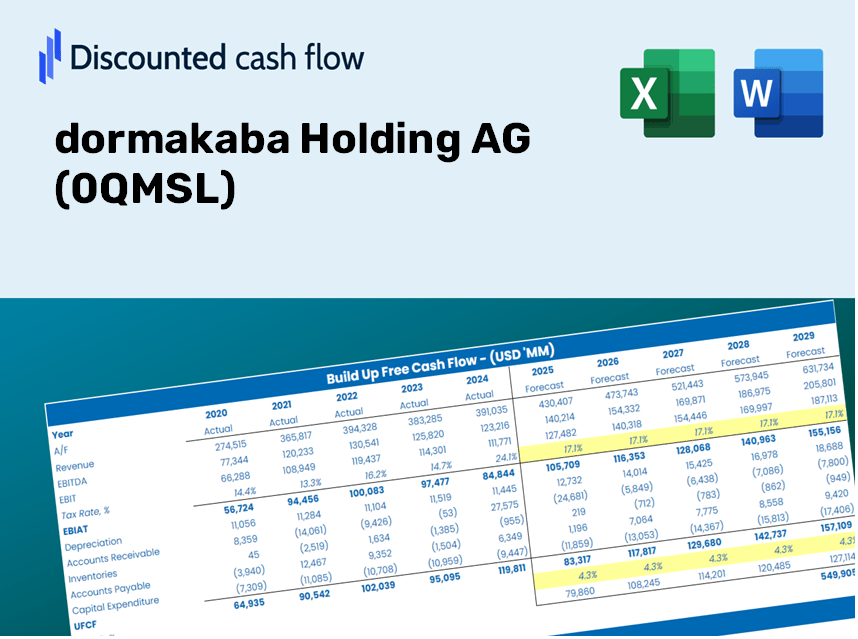
dormakaba Holding AG (0QMS.L) DCF Valuation |
Fully Editable: Tailor To Your Needs In Excel Or Sheets
Professional Design: Trusted, Industry-Standard Templates
Investor-Approved Valuation Models
MAC/PC Compatible, Fully Unlocked
No Expertise Is Needed; Easy To Follow
dormakaba Holding AG (0QMS.L) Bundle
Whether you’re an investor or analyst, this (0QMSL) DCF Calculator is your go-to resource for accurate valuation. Equipped with real data from dormakaba Holding AG, you can adjust forecasts and instantly observe the effects.
Discounted Cash Flow (DCF) - (USD MM)
| Year | AY1 2020 |
AY2 2021 |
AY3 2022 |
AY4 2023 |
AY5 2024 |
FY1 2025 |
FY2 2026 |
FY3 2027 |
FY4 2028 |
FY5 2029 |
|---|---|---|---|---|---|---|---|---|---|---|
| Revenue | 2,499.7 | 2,756.9 | 2,848.8 | 2,837.1 | 2,870.1 | 2,973.2 | 3,080.1 | 3,190.8 | 3,305.5 | 3,424.3 |
| Revenue Growth, % | 0 | 10.29 | 3.33 | -0.4107 | 1.16 | 3.59 | 3.59 | 3.59 | 3.59 | 3.59 |
| EBITDA | 351.6 | 337.1 | 323.0 | 299.5 | 390.8 | 367.5 | 380.7 | 394.4 | 408.6 | 423.3 |
| EBITDA, % | 14.07 | 12.23 | 11.34 | 10.56 | 13.62 | 12.36 | 12.36 | 12.36 | 12.36 | 12.36 |
| Depreciation | 78.8 | 239.0 | 136.8 | 128.1 | 103.6 | 147.2 | 152.5 | 157.9 | 163.6 | 169.5 |
| Depreciation, % | 3.15 | 8.67 | 4.8 | 4.52 | 3.61 | 4.95 | 4.95 | 4.95 | 4.95 | 4.95 |
| EBIT | 272.8 | 98.1 | 186.2 | 171.4 | 287.2 | 220.4 | 228.3 | 236.5 | 245.0 | 253.8 |
| EBIT, % | 10.91 | 3.56 | 6.54 | 6.04 | 10.01 | 7.41 | 7.41 | 7.41 | 7.41 | 7.41 |
| Total Cash | 169.1 | 104.5 | 122.1 | 150.4 | 445.1 | 212.0 | 219.6 | 227.5 | 235.7 | 244.2 |
| Total Cash, percent | .0 | .0 | .0 | .0 | .0 | .0 | .0 | .0 | .0 | .0 |
| Account Receivables | 431.1 | 490.7 | 469.9 | 495.6 | 470.5 | 507.8 | 526.1 | 545.0 | 564.6 | 584.9 |
| Account Receivables, % | 17.25 | 17.8 | 16.49 | 17.47 | 16.39 | 17.08 | 17.08 | 17.08 | 17.08 | 17.08 |
| Inventories | 450.6 | 537.0 | 487.7 | 497.0 | 476.7 | 527.8 | 546.7 | 566.4 | 586.7 | 607.8 |
| Inventories, % | 18.03 | 19.48 | 17.12 | 17.52 | 16.61 | 17.75 | 17.75 | 17.75 | 17.75 | 17.75 |
| Accounts Payable | 169.1 | 178.7 | 163.5 | 180.2 | 187.5 | 189.5 | 196.3 | 203.4 | 210.7 | 218.3 |
| Accounts Payable, % | 6.76 | 6.48 | 5.74 | 6.35 | 6.53 | 6.37 | 6.37 | 6.37 | 6.37 | 6.37 |
| Capital Expenditure | -76.1 | -78.5 | -98.5 | -98.6 | -107.1 | -98.5 | -102.0 | -105.7 | -109.5 | -113.4 |
| Capital Expenditure, % | -3.04 | -2.85 | -3.46 | -3.48 | -3.73 | -3.31 | -3.31 | -3.31 | -3.31 | -3.31 |
| Tax Rate, % | 61.35 | 61.35 | 61.35 | 61.35 | 61.35 | 61.35 | 61.35 | 61.35 | 61.35 | 61.35 |
| EBITAT | 110.2 | 25.4 | 60.1 | 53.9 | 111.0 | 74.3 | 77.0 | 79.8 | 82.6 | 85.6 |
| Depreciation | ||||||||||
| Changes in Account Receivables | ||||||||||
| Changes in Inventories | ||||||||||
| Changes in Accounts Payable | ||||||||||
| Capital Expenditure | ||||||||||
| UFCF | -599.7 | 49.5 | 153.3 | 65.1 | 160.2 | 36.7 | 97.1 | 100.5 | 104.2 | 107.9 |
| WACC, % | 6.65 | 6.51 | 6.57 | 6.57 | 6.63 | 6.59 | 6.59 | 6.59 | 6.59 | 6.59 |
| PV UFCF | ||||||||||
| SUM PV UFCF | 362.0 | |||||||||
| Long Term Growth Rate, % | 2.00 | |||||||||
| Free cash flow (T + 1) | 110 | |||||||||
| Terminal Value | 2,400 | |||||||||
| Present Terminal Value | 1,745 | |||||||||
| Enterprise Value | 2,107 | |||||||||
| Net Debt | 355 | |||||||||
| Equity Value | 1,751 | |||||||||
| Diluted Shares Outstanding, MM | 4 | |||||||||
| Equity Value Per Share | 418.65 |
What You Will Receive
- Authentic dormakaba Data: Preloaded financial metrics – covering everything from revenue to EBIT – derived from actual and projected outcomes.
- Complete Customization: Modify all essential parameters (highlighted cells) such as WACC, growth %, and tax rates.
- Immediate Valuation Adjustments: Automatic recalculations to assess the influence of changes on dormakaba’s fair value.
- Flexible Excel Template: Designed for quick modifications, scenario analysis, and comprehensive projections.
- Efficient and Precise: Avoid building models from the ground up while ensuring accuracy and adaptability.
Key Features
- Comprehensive DCF Calculator: Features detailed unlevered and levered DCF valuation models tailored for dormakaba Holding AG (0QMSL).
- WACC Calculator: Pre-configured Weighted Average Cost of Capital sheet with adjustable inputs for customization.
- Flexible Forecast Assumptions: Easily alter growth projections, capital expenditures, and discount rates.
- Integrated Financial Ratios: Evaluate profitability, leverage, and efficiency ratios specifically for dormakaba Holding AG (0QMSL).
- User-Friendly Dashboard and Charts: Visual representations that summarize critical valuation metrics for streamlined analysis.
How It Works
- Step 1: Download the prebuilt Excel template featuring dormakaba Holding AG's (0QMSL) data.
- Step 2: Review the pre-filled sheets to grasp the essential metrics.
- Step 3: Modify forecasts and assumptions in the editable yellow cells (WACC, growth, margins).
- Step 4: Instantly access recalibrated results, including dormakaba Holding AG's (0QMSL) intrinsic value.
- Step 5: Utilize the outputs to make well-informed investment decisions or create reports.
Why Opt for This Calculator?
- All-in-One Solution: Features DCF, WACC, and financial ratio analyses seamlessly integrated.
- Flexible Inputs: Modify the yellow-highlighted cells to explore different scenarios.
- In-Depth Analysis: Automatically computes the intrinsic value and Net Present Value for dormakaba Holding AG (0QMSL).
- Preloaded Information: Comes with historical and projected data for precise analysis.
- Professional Grade: Perfect for financial analysts, investors, and business consultants.
Who Should Utilize This Product?
- Investors: Leverage a professional-grade valuation tool to make informed investment choices.
- Financial Analysts: Enhance your efficiency with a customizable, pre-built DCF model.
- Consultants: Seamlessly modify the template for client presentations or reports.
- Finance Enthusiasts: Expand your knowledge of valuation methods through practical, real-world examples.
- Educators and Students: Incorporate it into finance-related coursework for hands-on learning.
Contents of the Template
- Pre-Filled DCF Model: dormakaba Holding AG’s financial data preloaded for immediate use.
- WACC Calculator: Comprehensive calculations for Weighted Average Cost of Capital.
- Financial Ratios: Assess dormakaba’s profitability, leverage, and efficiency metrics.
- Editable Inputs: Adjust assumptions such as growth rates, margins, and CAPEX to suit your scenarios.
- Financial Statements: Annual and quarterly reports for thorough analysis.
- Interactive Dashboard: Effortlessly visualize key valuation metrics and outcomes.
Disclaimer
All information, articles, and product details provided on this website are for general informational and educational purposes only. We do not claim any ownership over, nor do we intend to infringe upon, any trademarks, copyrights, logos, brand names, or other intellectual property mentioned or depicted on this site. Such intellectual property remains the property of its respective owners, and any references here are made solely for identification or informational purposes, without implying any affiliation, endorsement, or partnership.
We make no representations or warranties, express or implied, regarding the accuracy, completeness, or suitability of any content or products presented. Nothing on this website should be construed as legal, tax, investment, financial, medical, or other professional advice. In addition, no part of this site—including articles or product references—constitutes a solicitation, recommendation, endorsement, advertisement, or offer to buy or sell any securities, franchises, or other financial instruments, particularly in jurisdictions where such activity would be unlawful.
All content is of a general nature and may not address the specific circumstances of any individual or entity. It is not a substitute for professional advice or services. Any actions you take based on the information provided here are strictly at your own risk. You accept full responsibility for any decisions or outcomes arising from your use of this website and agree to release us from any liability in connection with your use of, or reliance upon, the content or products found herein.