
|
Lonza Group AG (0QNO.L) DCF Valuation |
Fully Editable: Tailor To Your Needs In Excel Or Sheets
Professional Design: Trusted, Industry-Standard Templates
Investor-Approved Valuation Models
MAC/PC Compatible, Fully Unlocked
No Expertise Is Needed; Easy To Follow
Lonza Group AG (0QNO.L) Bundle
Explore the financial prospects of Lonza Group AG (0QNOL) with our user-friendly DCF Calculator! Enter your assumptions regarding growth, margins, and expenses to determine the intrinsic value of Lonza Group AG (0QNOL) and enhance your investment approach.
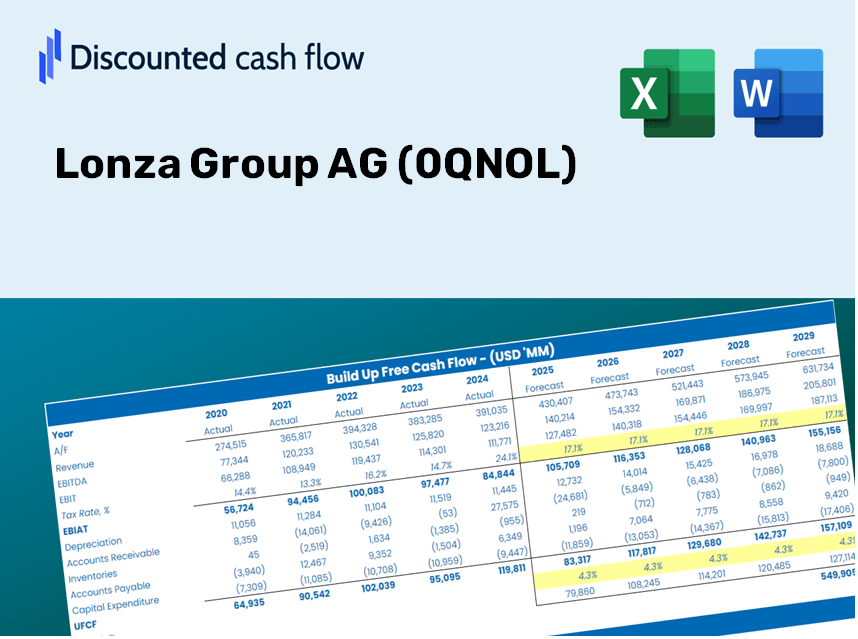
Discounted Cash Flow (DCF) - (USD MM)
| Year | AY1 2020 |
AY2 2021 |
AY3 2022 |
AY4 2023 |
AY5 2024 |
FY1 2025 |
FY2 2026 |
FY3 2027 |
FY4 2028 |
FY5 2029 |
|---|---|---|---|---|---|---|---|---|---|---|
| Revenue | 4,508.0 | 5,409.0 | 6,223.0 | 6,717.0 | 6,574.0 | 7,245.3 | 7,985.1 | 8,800.5 | 9,699.1 | 10,689.6 |
| Revenue Growth, % | 0 | 19.99 | 15.05 | 7.94 | -2.13 | 10.21 | 10.21 | 10.21 | 10.21 | 10.21 |
| EBITDA | 1,386.0 | 1,382.0 | 2,115.0 | 1,532.0 | 1,542.0 | 1,978.6 | 2,180.7 | 2,403.3 | 2,648.8 | 2,919.2 |
| EBITDA, % | 30.75 | 25.55 | 33.99 | 22.81 | 23.46 | 27.31 | 27.31 | 27.31 | 27.31 | 27.31 |
| Depreciation | 526.0 | 522.0 | 596.0 | 621.0 | 647.0 | 724.3 | 798.2 | 879.8 | 969.6 | 1,068.6 |
| Depreciation, % | 11.67 | 9.65 | 9.58 | 9.25 | 9.84 | 10 | 10 | 10 | 10 | 10 |
| EBIT | 860.0 | 860.0 | 1,519.0 | 911.0 | 895.0 | 1,254.3 | 1,382.4 | 1,523.6 | 1,679.2 | 1,850.6 |
| EBIT, % | 19.08 | 15.9 | 24.41 | 13.56 | 13.61 | 17.31 | 17.31 | 17.31 | 17.31 | 17.31 |
| Total Cash | 495.0 | 3,184.0 | 2,224.0 | 1,668.0 | 1,711.0 | 2,266.9 | 2,498.4 | 2,753.6 | 3,034.7 | 3,344.6 |
| Total Cash, percent | .0 | .0 | .0 | .0 | .0 | .0 | .0 | .0 | .0 | .0 |
| Account Receivables | 994.0 | 1,136.0 | 1,168.0 | 1,433.0 | 1,574.0 | 1,551.9 | 1,710.4 | 1,885.0 | 2,077.5 | 2,289.6 |
| Account Receivables, % | 22.05 | 21 | 18.77 | 21.33 | 23.94 | 21.42 | 21.42 | 21.42 | 21.42 | 21.42 |
| Inventories | 1,136.0 | 1,501.0 | 1,819.0 | 1,585.0 | 1,727.0 | 1,913.4 | 2,108.8 | 2,324.2 | 2,561.5 | 2,823.0 |
| Inventories, % | 25.2 | 27.75 | 29.23 | 23.6 | 26.27 | 26.41 | 26.41 | 26.41 | 26.41 | 26.41 |
| Accounts Payable | 308.0 | 483.0 | 477.0 | 468.0 | 406.0 | 529.9 | 584.0 | 643.7 | 709.4 | 781.8 |
| Accounts Payable, % | 6.83 | 8.93 | 7.67 | 6.97 | 6.18 | 7.31 | 7.31 | 7.31 | 7.31 | 7.31 |
| Capital Expenditure | -973.0 | -1,346.0 | -1,872.0 | -1,682.0 | -1,417.0 | -1,784.5 | -1,966.7 | -2,167.5 | -2,388.8 | -2,632.7 |
| Capital Expenditure, % | -21.58 | -24.88 | -30.08 | -25.04 | -21.55 | -24.63 | -24.63 | -24.63 | -24.63 | -24.63 |
| Tax Rate, % | 15.65 | 15.65 | 15.65 | 15.65 | 15.65 | 15.65 | 15.65 | 15.65 | 15.65 | 15.65 |
| EBITAT | 947.2 | 3,213.0 | 1,276.3 | 754.2 | 754.9 | 1,131.8 | 1,247.4 | 1,374.8 | 1,515.2 | 1,669.9 |
| Depreciation | ||||||||||
| Changes in Account Receivables | ||||||||||
| Changes in Inventories | ||||||||||
| Changes in Accounts Payable | ||||||||||
| Capital Expenditure | ||||||||||
| UFCF | -1,321.8 | 2,057.0 | -355.7 | -346.8 | -360.1 | 31.2 | -220.8 | -243.3 | -268.2 | -295.5 |
| WACC, % | 7.71 | 7.71 | 7.64 | 7.63 | 7.64 | 7.66 | 7.66 | 7.66 | 7.66 | 7.66 |
| PV UFCF | ||||||||||
| SUM PV UFCF | -760.3 | |||||||||
| Long Term Growth Rate, % | 3.00 | |||||||||
| Free cash flow (T + 1) | -304 | |||||||||
| Terminal Value | -6,529 | |||||||||
| Present Terminal Value | -4,514 | |||||||||
| Enterprise Value | -5,274 | |||||||||
| Net Debt | 4,009 | |||||||||
| Equity Value | -9,283 | |||||||||
| Diluted Shares Outstanding, MM | 71 | |||||||||
| Equity Value Per Share | -130.20 |
What You Will Receive
- Genuine Lonza Financial Insights: Pre-loaded with historical and projected data for accurate analysis of Lonza Group AG (0QNOL).
- Fully Customizable Template: Easily adjust key metrics such as revenue growth, WACC, and EBITDA %.
- Instant Calculations: Watch the intrinsic value of Lonza update in real-time as you make adjustments.
- Professional Valuation Resource: Tailored for investors, analysts, and consultants aiming for precise DCF outcomes.
- Intuitive Layout: Streamlined design and straightforward guidelines suitable for all skill levels.
Key Features
- Real-Life Lonza Data: Pre-filled with Lonza Group AG's historical financials and future projections.
- Fully Customizable Inputs: Tailor revenue growth, profit margins, WACC, tax rates, and capital expenditure parameters.
- Dynamic Valuation Model: Automatic recalibration of Net Present Value (NPV) and intrinsic value in response to your inputs.
- Scenario Analysis: Develop various forecast scenarios to explore different valuation results.
- User-Friendly Interface: Intuitive, organized, and crafted for both seasoned professionals and newcomers.
How It Works
- Download: Get the pre-built Excel file containing Lonza Group AG’s (0QNOL) financial data.
- Customize: Modify forecasts such as revenue growth, EBITDA %, and WACC to fit your analysis.
- Update Automatically: Enjoy real-time updates for intrinsic value and NPV calculations.
- Test Scenarios: Generate multiple projections and compare results on the fly.
- Make Decisions: Leverage the valuation insights to inform your investment approach.
Why Choose This Lonza Group AG Calculator?
- Precision: Utilizes authentic Lonza financial data to ensure accurate calculations.
- Versatility: Created for users to experiment with and adjust inputs as needed.
- Efficiency: Eliminate the complexity of constructing a DCF model from the ground up.
- Expert-Level: Crafted with the accuracy and functionality expected by CFOs.
- Accessible: Designed for ease of use, suitable for individuals without extensive financial modeling skills.
Who Can Benefit from This Product?
- Investors: Evaluate the valuation of Lonza Group AG (0QNOL) before making stock trades.
- CFOs and Financial Analysts: Enhance valuation processes and validate financial projections.
- Startup Founders: Understand how leading firms like Lonza Group AG (0QNOL) are valued in the market.
- Consultants: Provide detailed valuation reports to clients using industry benchmarks.
- Students and Educators: Apply practical data for learning and teaching valuation methods.
Contents of the Template
- Operating and Balance Sheet Data: Pre-filled historical data and forecasts for Lonza Group AG (0QNOL), including metrics such as revenue, EBITDA, EBIT, and capital expenditures.
- WACC Calculation: A specific sheet dedicated to calculating the Weighted Average Cost of Capital (WACC), encompassing parameters like Beta, risk-free rate, and share price.
- DCF Valuation (Unlevered and Levered): Customizable Discounted Cash Flow models that detail intrinsic value along with comprehensive calculations.
- Financial Statements: Pre-loaded annual and quarterly financial statements to facilitate thorough analysis.
- Key Ratios: A range of profitability, leverage, and efficiency ratios pertinent to Lonza Group AG (0QNOL).
- Dashboard and Charts: A visual overview of valuation results and assumptions, enabling straightforward analysis of outcomes.
Disclaimer
All information, articles, and product details provided on this website are for general informational and educational purposes only. We do not claim any ownership over, nor do we intend to infringe upon, any trademarks, copyrights, logos, brand names, or other intellectual property mentioned or depicted on this site. Such intellectual property remains the property of its respective owners, and any references here are made solely for identification or informational purposes, without implying any affiliation, endorsement, or partnership.
We make no representations or warranties, express or implied, regarding the accuracy, completeness, or suitability of any content or products presented. Nothing on this website should be construed as legal, tax, investment, financial, medical, or other professional advice. In addition, no part of this site—including articles or product references—constitutes a solicitation, recommendation, endorsement, advertisement, or offer to buy or sell any securities, franchises, or other financial instruments, particularly in jurisdictions where such activity would be unlawful.
All content is of a general nature and may not address the specific circumstances of any individual or entity. It is not a substitute for professional advice or services. Any actions you take based on the information provided here are strictly at your own risk. You accept full responsibility for any decisions or outcomes arising from your use of this website and agree to release us from any liability in connection with your use of, or reliance upon, the content or products found herein.