
|
Allreal Holding AG (0QPD.L) DCF Valuation |
Fully Editable: Tailor To Your Needs In Excel Or Sheets
Professional Design: Trusted, Industry-Standard Templates
Investor-Approved Valuation Models
MAC/PC Compatible, Fully Unlocked
No Expertise Is Needed; Easy To Follow
Allreal Holding AG (0QPD.L) Bundle
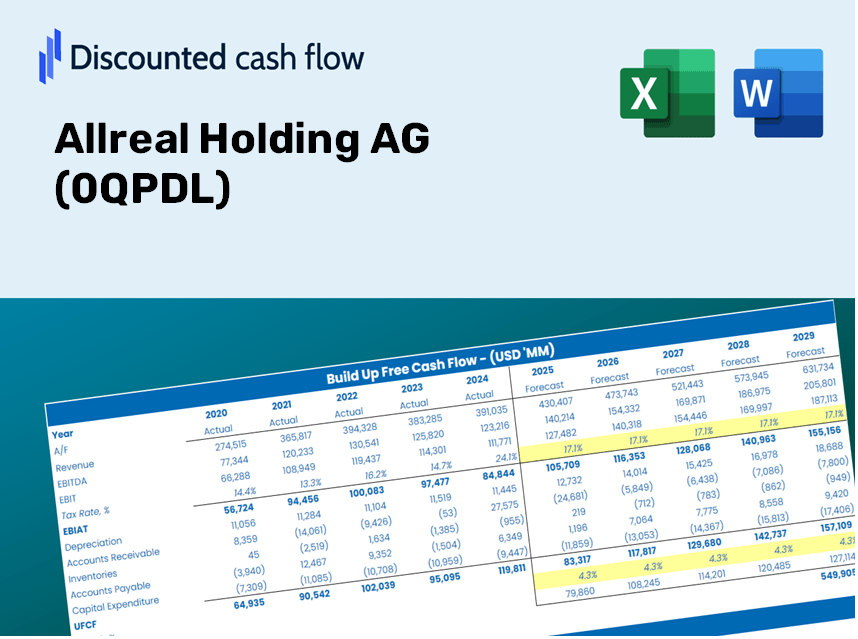
As an investor or analyst, this (0QPDL) DCF Calculator is your go-to resource for accurate valuation. Featuring real data from Allreal Holding AG, you can adjust forecasts and observe the effects in real-time.
Discounted Cash Flow (DCF) - (USD MM)
| Year | AY1 2020 |
AY2 2021 |
AY3 2022 |
AY4 2023 |
AY5 2024 |
FY1 2025 |
FY2 2026 |
FY3 2027 |
FY4 2028 |
FY5 2029 |
|---|---|---|---|---|---|---|---|---|---|---|
| Revenue | 516.4 | 552.9 | 502.0 | 428.3 | 420.0 | 400.3 | 381.5 | 363.6 | 346.6 | 330.3 |
| Revenue Growth, % | 0 | 7.07 | -9.21 | -14.68 | -1.94 | -4.69 | -4.69 | -4.69 | -4.69 | -4.69 |
| EBITDA | 171.4 | 183.8 | 185.7 | 119.2 | 314.8 | 165.1 | 157.4 | 150.0 | 142.9 | 136.2 |
| EBITDA, % | 33.19 | 33.24 | 36.99 | 27.83 | 74.95 | 41.24 | 41.24 | 41.24 | 41.24 | 41.24 |
| Depreciation | 1.3 | 1.5 | 1.8 | 2.2 | 2.4 | 1.6 | 1.5 | 1.4 | 1.4 | 1.3 |
| Depreciation, % | 0.25174 | 0.2713 | 0.35857 | 0.51366 | 0.57143 | 0.39334 | 0.39334 | 0.39334 | 0.39334 | 0.39334 |
| EBIT | 170.1 | 182.3 | 183.9 | 117.0 | 312.4 | 163.5 | 155.9 | 148.5 | 141.6 | 134.9 |
| EBIT, % | 32.94 | 32.97 | 36.63 | 27.32 | 74.38 | 40.85 | 40.85 | 40.85 | 40.85 | 40.85 |
| Total Cash | 40.5 | 73.4 | 14.1 | 12.6 | 4.1 | 22.3 | 21.2 | 20.3 | 19.3 | 18.4 |
| Total Cash, percent | .0 | .0 | .0 | .0 | .0 | .0 | .0 | .0 | .0 | .0 |
| Account Receivables | .0 | .0 | .0 | 10.6 | 69.3 | 15.2 | 14.5 | 13.8 | 13.2 | 12.5 |
| Account Receivables, % | 0 | 0 | 0 | 2.47 | 16.5 | 3.79 | 3.79 | 3.79 | 3.79 | 3.79 |
| Inventories | .0 | .0 | .0 | 471.7 | 512.0 | 160.1 | 152.6 | 145.5 | 138.6 | 132.1 |
| Inventories, % | 0 | 0 | 0 | 110.13 | 121.9 | 40 | 40 | 40 | 40 | 40 |
| Accounts Payable | 68.9 | 107.4 | 65.4 | 55.6 | 67.1 | 59.8 | 57.0 | 54.4 | 51.8 | 49.4 |
| Accounts Payable, % | 13.34 | 19.42 | 13.03 | 12.98 | 15.98 | 14.95 | 14.95 | 14.95 | 14.95 | 14.95 |
| Capital Expenditure | -39.5 | -.2 | -4.7 | -6.6 | -3.6 | -8.8 | -8.4 | -8.0 | -7.6 | -7.3 |
| Capital Expenditure, % | -7.65 | -0.03617291 | -0.93625 | -1.54 | -0.85714 | -2.2 | -2.2 | -2.2 | -2.2 | -2.2 |
| Tax Rate, % | 23.46 | 23.46 | 23.46 | 23.46 | 23.46 | 23.46 | 23.46 | 23.46 | 23.46 | 23.46 |
| EBITAT | 135.6 | 143.2 | 154.2 | 89.9 | 239.1 | 129.3 | 123.3 | 117.5 | 112.0 | 106.7 |
| Depreciation | ||||||||||
| Changes in Account Receivables | ||||||||||
| Changes in Inventories | ||||||||||
| Changes in Accounts Payable | ||||||||||
| Capital Expenditure | ||||||||||
| UFCF | 166.3 | 183.0 | 109.3 | -406.6 | 150.4 | 520.8 | 121.8 | 116.1 | 110.6 | 105.4 |
| WACC, % | 4.82 | 4.8 | 4.89 | 4.77 | 4.77 | 4.81 | 4.81 | 4.81 | 4.81 | 4.81 |
| PV UFCF | ||||||||||
| SUM PV UFCF | 883.6 | |||||||||
| Long Term Growth Rate, % | 2.00 | |||||||||
| Free cash flow (T + 1) | 108 | |||||||||
| Terminal Value | 3,827 | |||||||||
| Present Terminal Value | 3,026 | |||||||||
| Enterprise Value | 3,910 | |||||||||
| Net Debt | 2,696 | |||||||||
| Equity Value | 1,214 | |||||||||
| Diluted Shares Outstanding, MM | 17 | |||||||||
| Equity Value Per Share | 73.51 |
What You Will Receive
- Adjustable Forecast Inputs: Easily modify assumptions (growth %, margins, WACC) to generate various scenarios.
- Comprehensive Data: Allreal Holding AG’s financial information pre-loaded to facilitate your analysis.
- Automated DCF Outputs: The template computes Net Present Value (NPV) and intrinsic value automatically.
- Customizable and Professional Design: A refined Excel model tailored to fit your valuation requirements.
- Designed for Analysts and Investors: Perfect for assessing projections, validating strategies, and optimizing your time.
Key Features
- Real-Life ALRN Data: Pre-loaded with Allreal Holding AG's historical financials and future performance forecasts.
- Completely Customizable Inputs: Modify revenue growth rates, profit margins, WACC, tax rates, and capital expenditures.
- Dynamic Valuation Model: Automatic recalculation of Net Present Value (NPV) and intrinsic value based on your adjustments.
- Scenario Analysis: Develop various forecasting scenarios to explore different valuation possibilities.
- User-Friendly Layout: Intuitive, well-structured, suitable for both professionals and newcomers.
Understanding the Process
- Step 1: Download the Excel file for Allreal Holding AG (0QPDL).
- Step 2: Examine the pre-filled data for Allreal, including both historical and forecasted figures.
- Step 3: Modify key assumptions (highlighted in yellow) according to your analysis.
- Step 4: Observe the automatic recalculations that reflect Allreal Holding AG’s intrinsic value.
- Step 5: Utilize the results for your investment strategies or reporting needs.
Why Choose the Allreal Holding AG Calculator?
- Time Efficient: Skip the hassle of building a DCF model from the ground up – it's ready for immediate use.
- Enhanced Precision: Access to accurate financial data and formulas minimizes valuation errors.
- Completely Customizable: Adjust the model to align with your unique assumptions and forecasts.
- User-Friendly Presentation: Intuitive charts and outputs simplify the analysis of results.
- Favored by Professionals: Crafted for experts who prioritize accuracy and functionality.
Who Can Benefit from This Product?
- Investors: Accurately assess the fair value of Allreal Holding AG (0QPDL) before making investment choices.
- CFOs: Utilize a professional-grade DCF model for comprehensive financial reporting and analysis.
- Consultants: Easily customize the template for client valuation reports.
- Entrepreneurs: Acquire insights into financial modeling practices employed by leading firms.
- Educators: Implement it as a teaching resource to illustrate valuation methodologies.
Components of the Template
- Pre-Filled Data: Contains Allreal Holding AG's historical financials and projections.
- Discounted Cash Flow Model: An editable DCF valuation model with automatic calculations.
- Weighted Average Cost of Capital (WACC): A specific sheet for calculating WACC based on user-defined inputs.
- Key Financial Ratios: Evaluate Allreal Holding AG's profitability, efficiency, and leverage.
- Customizable Inputs: Adjust revenue growth, profit margins, and tax rates effortlessly.
- Clear Dashboard: Visual representations and tables summarizing essential valuation outcomes.
Disclaimer
All information, articles, and product details provided on this website are for general informational and educational purposes only. We do not claim any ownership over, nor do we intend to infringe upon, any trademarks, copyrights, logos, brand names, or other intellectual property mentioned or depicted on this site. Such intellectual property remains the property of its respective owners, and any references here are made solely for identification or informational purposes, without implying any affiliation, endorsement, or partnership.
We make no representations or warranties, express or implied, regarding the accuracy, completeness, or suitability of any content or products presented. Nothing on this website should be construed as legal, tax, investment, financial, medical, or other professional advice. In addition, no part of this site—including articles or product references—constitutes a solicitation, recommendation, endorsement, advertisement, or offer to buy or sell any securities, franchises, or other financial instruments, particularly in jurisdictions where such activity would be unlawful.
All content is of a general nature and may not address the specific circumstances of any individual or entity. It is not a substitute for professional advice or services. Any actions you take based on the information provided here are strictly at your own risk. You accept full responsibility for any decisions or outcomes arising from your use of this website and agree to release us from any liability in connection with your use of, or reliance upon, the content or products found herein.