
|
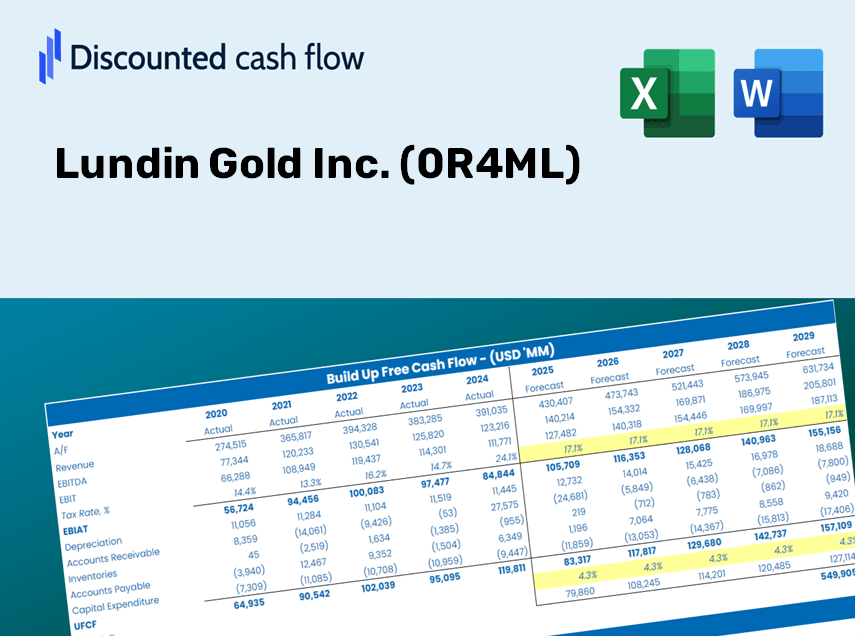
Lundin Gold Inc. (0R4M.L) DCF Valuation |
Fully Editable: Tailor To Your Needs In Excel Or Sheets
Professional Design: Trusted, Industry-Standard Templates
Investor-Approved Valuation Models
MAC/PC Compatible, Fully Unlocked
No Expertise Is Needed; Easy To Follow
Lundin Gold Inc. (0R4M.L) Bundle
For both investors and analysts, the Lundin Gold Inc. (0R4ML) DCF Calculator serves as your go-to resource for accurate valuation. Equipped with real data from Lundin Gold Inc., you can easily adjust forecasts and observe the effects in real time.
Benefits You'll Experience
- Ready-to-Use Financial Model: Lundin Gold Inc.'s actual data facilitates accurate DCF valuation.
- Comprehensive Forecast Control: Modify revenue growth rates, profit margins, WACC, and other critical variables.
- Real-Time Calculations: Automatic updates allow you to view outcomes as adjustments are made.
- Professionally Designed Template: A polished Excel file crafted for high-quality valuation needs.
- Flexible and Reusable: Designed for adaptability, enabling ongoing use for in-depth forecasting.
Key Features
- Comprehensive DCF Calculator: Offers detailed unlevered and levered DCF valuation models tailored for Lundin Gold Inc. (0R4ML).
- WACC Calculator: Features a pre-configured Weighted Average Cost of Capital sheet with adjustable inputs for enhanced precision.
- Customizable Forecast Assumptions: Easily modify parameters such as growth rates, capital expenditures, and discount rates.
- Integrated Financial Ratios: Evaluate profitability, leverage, and efficiency ratios specifically for Lundin Gold Inc. (0R4ML).
- Interactive Dashboard and Charts: Provides visual summaries of essential valuation metrics for straightforward analysis.
How It Functions
- Step 1: Download the Excel spreadsheet.
- Step 2: Examine Lundin Gold Inc.'s (0R4ML) pre-filled financial data and projections.
- Step 3: Adjust key inputs such as revenue growth, WACC, and tax rates (highlighted cells).
- Step 4: Observe the DCF model update in real-time as you modify your assumptions.
- Step 5: Review the outputs and utilize the results for your investment strategies.
Why Opt for This Calculator?
- All-in-One Solution: Integrates DCF, WACC, and financial ratio analyses seamlessly.
- Flexible Inputs: Modify the yellow-highlighted cells to explore different scenarios.
- In-Depth Analysis: Automatically computes Lundin Gold Inc.'s intrinsic value and Net Present Value.
- Preloaded Information: Features historical and projected data for reliable starting points.
- High-Quality Design: Perfect for financial analysts, investors, and business consultants.
Who Can Benefit from This Product?
- Finance Students: Discover valuation methods and practice them with actual data.
- Academics: Integrate professional valuation models into your teaching or research projects.
- Investors: Challenge your assumptions and evaluate valuation results for Lundin Gold Inc. (0R4ML).
- Analysts: Enhance your efficiency using a pre-configured, customizable DCF model.
- Small Business Owners: Understand the analytical approaches used for large public companies like Lundin Gold Inc. (0R4ML).
Contents of the Template
- Pre-Filled Data: Comprises Lundin Gold Inc.'s historical financial data and projections.
- Discounted Cash Flow Model: Customizable DCF valuation model with automatic calculations.
- Weighted Average Cost of Capital (WACC): A specific sheet for calculating WACC based on user-defined inputs.
- Key Financial Ratios: Assess Lundin Gold Inc.'s profitability, efficiency, and financial leverage.
- Customizable Inputs: Easily adjust revenue growth, profit margins, and tax rates.
- Clear Dashboard: Visual representations and tables summarizing critical valuation outcomes.
Disclaimer
All information, articles, and product details provided on this website are for general informational and educational purposes only. We do not claim any ownership over, nor do we intend to infringe upon, any trademarks, copyrights, logos, brand names, or other intellectual property mentioned or depicted on this site. Such intellectual property remains the property of its respective owners, and any references here are made solely for identification or informational purposes, without implying any affiliation, endorsement, or partnership.
We make no representations or warranties, express or implied, regarding the accuracy, completeness, or suitability of any content or products presented. Nothing on this website should be construed as legal, tax, investment, financial, medical, or other professional advice. In addition, no part of this site—including articles or product references—constitutes a solicitation, recommendation, endorsement, advertisement, or offer to buy or sell any securities, franchises, or other financial instruments, particularly in jurisdictions where such activity would be unlawful.
All content is of a general nature and may not address the specific circumstances of any individual or entity. It is not a substitute for professional advice or services. Any actions you take based on the information provided here are strictly at your own risk. You accept full responsibility for any decisions or outcomes arising from your use of this website and agree to release us from any liability in connection with your use of, or reliance upon, the content or products found herein.