
|
Flughafen Wien Aktiengesellschaft (0RHU.L) DCF Valuation |
Fully Editable: Tailor To Your Needs In Excel Or Sheets
Professional Design: Trusted, Industry-Standard Templates
Investor-Approved Valuation Models
MAC/PC Compatible, Fully Unlocked
No Expertise Is Needed; Easy To Follow
Flughafen Wien AG (0RHU.L) Bundle
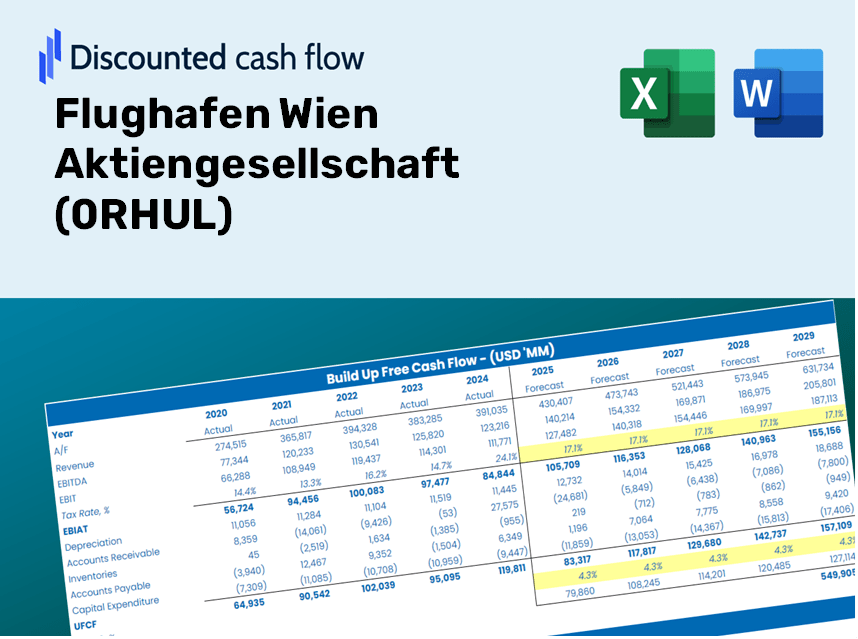
Explore Flughafen Wien Aktiengesellschaft's (0RHUL) financial outlook with our user-friendly DCF Calculator! Enter your projections for growth, margins, and expenses to calculate Flughafen Wien Aktiengesellschaft's (0RHUL) intrinsic value and inform your investment strategy.
Discounted Cash Flow (DCF) - (USD MM)
| Year | AY1 2020 |
AY2 2021 |
AY3 2022 |
AY4 2023 |
AY5 2024 |
FY1 2025 |
FY2 2026 |
FY3 2027 |
FY4 2028 |
FY5 2029 |
|---|---|---|---|---|---|---|---|---|---|---|
| Revenue | 333.7 | 407.0 | 692.7 | 931.5 | 1,052.7 | 1,420.3 | 1,916.2 | 2,585.3 | 3,487.9 | 4,705.7 |
| Revenue Growth, % | 0 | 21.98 | 70.19 | 34.48 | 13.01 | 34.92 | 34.92 | 34.92 | 34.92 | 34.92 |
| EBITDA | 49.1 | 156.6 | 292.9 | 401.5 | 458.3 | 517.3 | 697.9 | 941.5 | 1,270.3 | 1,713.8 |
| EBITDA, % | 14.7 | 38.47 | 42.29 | 43.1 | 43.54 | 36.42 | 36.42 | 36.42 | 36.42 | 36.42 |
| Depreciation | 132.5 | 134.1 | 123.1 | 131.8 | 135.8 | 333.7 | 450.2 | 607.5 | 819.5 | 1,105.7 |
| Depreciation, % | 39.72 | 32.95 | 17.77 | 14.14 | 12.9 | 23.5 | 23.5 | 23.5 | 23.5 | 23.5 |
| EBIT | -83.5 | 22.5 | 169.8 | 269.7 | 322.5 | 183.5 | 247.6 | 334.1 | 450.7 | 608.1 |
| EBIT, % | -25.02 | 5.52 | 24.52 | 28.95 | 30.64 | 12.92 | 12.92 | 12.92 | 12.92 | 12.92 |
| Total Cash | 200.0 | 150.8 | 130.7 | 74.0 | 72.8 | 371.3 | 500.9 | 675.8 | 911.8 | 1,230.1 |
| Total Cash, percent | .0 | .0 | .0 | .0 | .0 | .0 | .0 | .0 | .0 | .0 |
| Account Receivables | 66.4 | 134.6 | 399.0 | 438.7 | 90.5 | 472.3 | 637.2 | 859.6 | 1,159.8 | 1,564.7 |
| Account Receivables, % | 19.89 | 33.07 | 57.6 | 47.09 | 8.59 | 33.25 | 33.25 | 33.25 | 33.25 | 33.25 |
| Inventories | 5.9 | 6.4 | 7.3 | 7.7 | 8.4 | 17.1 | 23.1 | 31.1 | 42.0 | 56.7 |
| Inventories, % | 1.78 | 1.57 | 1.06 | 0.82159 | 0.79435 | 1.2 | 1.2 | 1.2 | 1.2 | 1.2 |
| Accounts Payable | 26.6 | 29.8 | 35.3 | 39.0 | 50.5 | 83.4 | 112.6 | 151.9 | 204.9 | 276.4 |
| Accounts Payable, % | 7.98 | 7.31 | 5.09 | 4.19 | 4.79 | 5.87 | 5.87 | 5.87 | 5.87 | 5.87 |
| Capital Expenditure | -99.2 | -60.7 | -60.5 | -97.8 | -169.8 | -227.2 | -306.6 | -413.6 | -558.0 | -752.8 |
| Capital Expenditure, % | -29.72 | -14.9 | -8.74 | -10.5 | -16.13 | -16 | -16 | -16 | -16 | -16 |
| Tax Rate, % | 32.77 | 32.77 | 32.77 | 32.77 | 32.77 | 32.77 | 32.77 | 32.77 | 32.77 | 32.77 |
| EBITAT | -62.7 | 15.6 | 116.0 | 176.3 | 216.8 | 126.8 | 171.1 | 230.9 | 311.5 | 420.2 |
| Depreciation | ||||||||||
| Changes in Account Receivables | ||||||||||
| Changes in Inventories | ||||||||||
| Changes in Accounts Payable | ||||||||||
| Capital Expenditure | ||||||||||
| UFCF | -75.0 | 23.6 | -81.2 | 173.9 | 541.8 | -124.2 | 173.1 | 233.5 | 315.0 | 425.0 |
| WACC, % | 4.66 | 4.65 | 4.65 | 4.65 | 4.65 | 4.65 | 4.65 | 4.65 | 4.65 | 4.65 |
| PV UFCF | ||||||||||
| SUM PV UFCF | 844.2 | |||||||||
| Long Term Growth Rate, % | 2.00 | |||||||||
| Free cash flow (T + 1) | 434 | |||||||||
| Terminal Value | 16,334 | |||||||||
| Present Terminal Value | 13,011 | |||||||||
| Enterprise Value | 13,856 | |||||||||
| Net Debt | 34 | |||||||||
| Equity Value | 13,822 | |||||||||
| Diluted Shares Outstanding, MM | 84 | |||||||||
| Equity Value Per Share | 164.79 |
What You Will Receive
- Flexible Forecast Inputs: Modify key assumptions (growth %, margins, WACC) effortlessly to generate various scenarios.
- Real-World Data: Flughafen Wien Aktiengesellschaft’s financial information pre-loaded to kickstart your analysis.
- Automated DCF Outputs: The template computes Net Present Value (NPV) and intrinsic value automatically for you.
- Customizable and Professional Design: A refined Excel model that adjusts to your valuation requirements.
- Designed for Analysts and Investors: Perfect for evaluating projections, corroborating strategies, and enhancing efficiency.
Key Features
- 🔍 Real-Life Flughafen Wien Financials: Pre-filled historical and projected data for Flughafen Wien Aktiengesellschaft (0RHUL).
- ✏️ Fully Customizable Inputs: Modify all essential parameters (yellow cells) such as WACC, growth %, and tax rates.
- 📊 Professional DCF Valuation: Integrated formulas compute Flughafen Wien's intrinsic value using the Discounted Cash Flow method.
- ⚡ Instant Results: Visualize Flughafen Wien's valuation immediately after making adjustments.
- Scenario Analysis: Evaluate and compare results for diverse financial assumptions side-by-side.
How It Works
- Step 1: Download the Excel file for Flughafen Wien Aktiengesellschaft (0RHUL).
- Step 2: Review the pre-filled financial data and forecasts for Flughafen Wien Aktiengesellschaft (0RHUL).
- Step 3: Adjust crucial inputs such as revenue growth, WACC, and tax rates (highlighted cells).
- Step 4: Observe the DCF model update in real-time as you modify your assumptions.
- Step 5: Evaluate the outputs and utilize the findings for your investment strategies.
Why Opt for This Calculator?
- All-in-One Solution: Combines DCF, WACC, and financial ratio analyses seamlessly.
- Tailored Inputs: Modify the yellow-highlighted fields to explore different scenarios.
- In-Depth Analysis: Automatically computes Flughafen Wien Aktiengesellschaft’s intrinsic value and Net Present Value.
- Preloaded Information: Historical and projected data provide reliable starting points.
- Expert-Grade Quality: Perfect for financial analysts, investors, and business consultants.
Who Should Benefit from This Product?
- Individual Investors: Make well-informed decisions regarding the purchase or sale of Flughafen Wien Aktiengesellschaft (0RHUL) stock.
- Financial Analysts: Enhance valuation methodologies with convenient, ready-made financial models.
- Consultants: Provide clients with expert valuation insights for Flughafen Wien Aktiengesellschaft (0RHUL) swiftly and accurately.
- Business Owners: Gain a better understanding of how large corporations like Flughafen Wien Aktiengesellschaft (0RHUL) are valued to inform your own strategic decisions.
- Finance Students: Master valuation techniques using practical, real-world data and situations related to Flughafen Wien Aktiengesellschaft (0RHUL).
Contents of the Template
- Preloaded VIE Data: Historical and forecasted financial metrics, including revenue, EBIT, and capital expenditures.
- DCF and WACC Models: High-quality templates for assessing intrinsic value and calculating Weighted Average Cost of Capital.
- Editable Inputs: Yellow-highlighted fields for modifying revenue growth rates, tax rates, and discount rates.
- Financial Statements: Detailed annual and quarterly financial reports for comprehensive analysis.
- Key Ratios: Metrics covering profitability, leverage, and efficiency for performance evaluation.
- Dashboard and Charts: Visual representations of valuation results and underlying assumptions.
Disclaimer
All information, articles, and product details provided on this website are for general informational and educational purposes only. We do not claim any ownership over, nor do we intend to infringe upon, any trademarks, copyrights, logos, brand names, or other intellectual property mentioned or depicted on this site. Such intellectual property remains the property of its respective owners, and any references here are made solely for identification or informational purposes, without implying any affiliation, endorsement, or partnership.
We make no representations or warranties, express or implied, regarding the accuracy, completeness, or suitability of any content or products presented. Nothing on this website should be construed as legal, tax, investment, financial, medical, or other professional advice. In addition, no part of this site—including articles or product references—constitutes a solicitation, recommendation, endorsement, advertisement, or offer to buy or sell any securities, franchises, or other financial instruments, particularly in jurisdictions where such activity would be unlawful.
All content is of a general nature and may not address the specific circumstances of any individual or entity. It is not a substitute for professional advice or services. Any actions you take based on the information provided here are strictly at your own risk. You accept full responsibility for any decisions or outcomes arising from your use of this website and agree to release us from any liability in connection with your use of, or reliance upon, the content or products found herein.