
|
Medicover AB (0RPS.L) DCF Valuation |
Fully Editable: Tailor To Your Needs In Excel Or Sheets
Professional Design: Trusted, Industry-Standard Templates
Investor-Approved Valuation Models
MAC/PC Compatible, Fully Unlocked
No Expertise Is Needed; Easy To Follow
Medicover AB (publ) (0RPS.L) Bundle
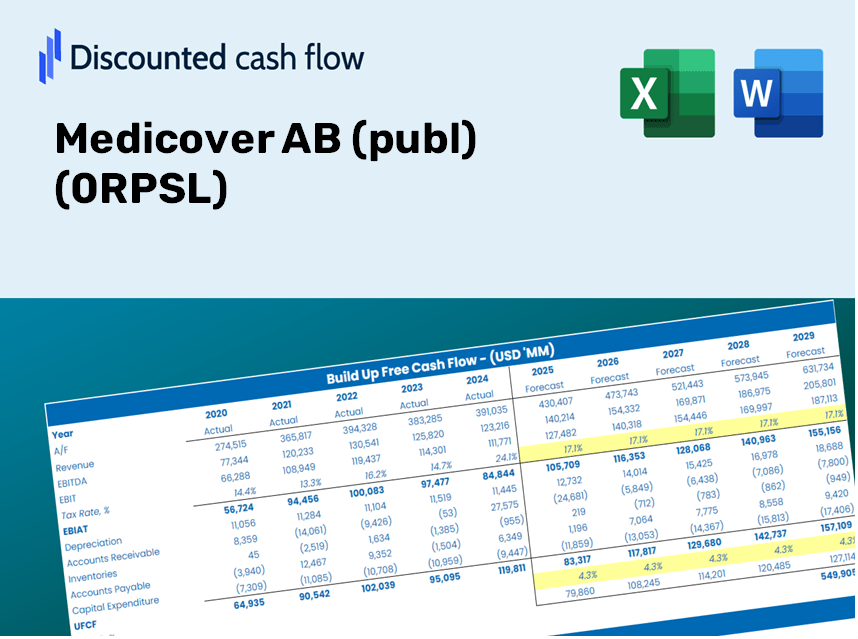
Designed for accuracy, our (0RPSL) DCF Calculator empowers you to evaluate Medicover AB (publ) valuation using real-world financial data, offering complete flexibility to modify all essential parameters for improved projections.
Discounted Cash Flow (DCF) - (USD MM)
| Year | AY1 2020 |
AY2 2021 |
AY3 2022 |
AY4 2023 |
AY5 2024 |
FY1 2025 |
FY2 2026 |
FY3 2027 |
FY4 2028 |
FY5 2029 |
|---|---|---|---|---|---|---|---|---|---|---|
| Revenue | 10,930.1 | 15,088.3 | 16,543.0 | 19,130.4 | 22,914.0 | 27,674.6 | 33,424.2 | 40,368.3 | 48,755.1 | 58,884.4 |
| Revenue Growth, % | 0 | 38.04 | 9.64 | 15.64 | 19.78 | 20.78 | 20.78 | 20.78 | 20.78 | 20.78 |
| EBITDA | 1,660.7 | 3,011.3 | 2,365.0 | 2,819.6 | 1,875.4 | 4,005.7 | 4,837.9 | 5,843.0 | 7,056.9 | 8,523.0 |
| EBITDA, % | 15.19 | 19.96 | 14.3 | 14.74 | 8.18 | 14.47 | 14.47 | 14.47 | 14.47 | 14.47 |
| Depreciation | 1,053.8 | 1,215.9 | 1,773.5 | 1,998.0 | 1,073.5 | 2,410.4 | 2,911.2 | 3,516.0 | 4,246.5 | 5,128.8 |
| Depreciation, % | 9.64 | 8.06 | 10.72 | 10.44 | 4.68 | 8.71 | 8.71 | 8.71 | 8.71 | 8.71 |
| EBIT | 606.9 | 1,795.4 | 591.5 | 821.6 | 801.8 | 1,595.2 | 1,926.6 | 2,326.9 | 2,810.3 | 3,394.2 |
| EBIT, % | 5.55 | 11.9 | 3.58 | 4.29 | 3.5 | 5.76 | 5.76 | 5.76 | 5.76 | 5.76 |
| Total Cash | 950.8 | 3,044.2 | 537.9 | 705.5 | 907.0 | 2,201.3 | 2,658.7 | 3,211.1 | 3,878.2 | 4,683.9 |
| Total Cash, percent | .0 | .0 | .0 | .0 | .0 | .0 | .0 | .0 | .0 | .0 |
| Account Receivables | 1,284.9 | 1,655.2 | 1,798.7 | 1,936.7 | 2,326.7 | 2,982.0 | 3,601.5 | 4,349.8 | 5,253.5 | 6,344.9 |
| Account Receivables, % | 11.76 | 10.97 | 10.87 | 10.12 | 10.15 | 10.78 | 10.78 | 10.78 | 10.78 | 10.78 |
| Inventories | 580.6 | 788.7 | 637.5 | 650.7 | 756.9 | 1,167.7 | 1,410.3 | 1,703.3 | 2,057.2 | 2,484.6 |
| Inventories, % | 5.31 | 5.23 | 3.85 | 3.4 | 3.3 | 4.22 | 4.22 | 4.22 | 4.22 | 4.22 |
| Accounts Payable | 587.1 | 663.8 | 668.2 | 744.9 | 2,732.0 | 1,639.8 | 1,980.5 | 2,392.0 | 2,888.9 | 3,489.1 |
| Accounts Payable, % | 5.37 | 4.4 | 4.04 | 3.89 | 11.92 | 5.93 | 5.93 | 5.93 | 5.93 | 5.93 |
| Capital Expenditure | -794.2 | -1,119.5 | -1,540.2 | -1,210.4 | -1,339.7 | -2,002.0 | -2,417.9 | -2,920.2 | -3,526.9 | -4,259.7 |
| Capital Expenditure, % | -7.27 | -7.42 | -9.31 | -6.33 | -5.85 | -7.23 | -7.23 | -7.23 | -7.23 | -7.23 |
| Tax Rate, % | 16.92 | 16.92 | 16.92 | 16.92 | 16.92 | 16.92 | 16.92 | 16.92 | 16.92 | 16.92 |
| EBITAT | 419.8 | 1,271.0 | 352.5 | 612.7 | 666.2 | 1,139.7 | 1,376.5 | 1,662.4 | 2,007.8 | 2,425.0 |
| Depreciation | ||||||||||
| Changes in Account Receivables | ||||||||||
| Changes in Inventories | ||||||||||
| Changes in Accounts Payable | ||||||||||
| Capital Expenditure | ||||||||||
| UFCF | -599.0 | 865.7 | 597.9 | 1,325.8 | 1,890.9 | -610.1 | 1,348.3 | 1,628.5 | 1,966.8 | 2,375.4 |
| WACC, % | 9.01 | 9.03 | 8.9 | 9.08 | 9.18 | 9.04 | 9.04 | 9.04 | 9.04 | 9.04 |
| PV UFCF | ||||||||||
| SUM PV UFCF | 4,762.7 | |||||||||
| Long Term Growth Rate, % | 2.00 | |||||||||
| Free cash flow (T + 1) | 2,423 | |||||||||
| Terminal Value | 34,410 | |||||||||
| Present Terminal Value | 22,322 | |||||||||
| Enterprise Value | 27,085 | |||||||||
| Net Debt | 12,807 | |||||||||
| Equity Value | 14,278 | |||||||||
| Diluted Shares Outstanding, MM | 150 | |||||||||
| Equity Value Per Share | 95.06 |
Benefits You Will Receive
- Pre-Filled Financial Model: Utilize Medicover AB's (0RPSL) actual data for accurate DCF valuation.
- Comprehensive Forecast Control: Modify key metrics such as revenue growth, margins, WACC, and other critical drivers.
- Real-Time Calculations: Enjoy automatic updates that display results as you make adjustments.
- Professional-Grade Template: Access a polished Excel file specifically designed for high-quality valuation.
- Flexible and Reusable: Crafted for adaptability, allowing for ongoing use in detailed forecasting.
Key Features
- Pre-Loaded Data: Medicover AB’s historical financial statements and pre-filled forecasts.
- Fully Adjustable Inputs: Modify WACC, tax rates, revenue growth, and EBITDA margins as needed.
- Instant Results: Witness Medicover AB's intrinsic value recalculate in real time.
- Clear Visual Outputs: Dashboard charts effectively showcase valuation results and key metrics.
- Built for Accuracy: A professional-grade tool tailored for analysts, investors, and finance professionals.
How It Functions
- 1. Access the Template: Download and open the Excel file containing Medicover AB’s (0RPSL) preloaded data.
- 2. Adjust Assumptions: Modify key inputs such as growth rates, WACC, and capital expenditures.
- 3. View Results Instantly: The DCF model automatically calculates intrinsic value and NPV in real-time.
- 4. Explore Scenarios: Evaluate various forecasts to investigate different valuation outcomes.
- 5. Present with Confidence: Deliver professional valuation insights to inform your decision-making.
Why Opt for This Calculator?
- Precise Data: Current Medicover AB (publ) (0RPSL) financials guarantee trustworthy valuation outcomes.
- Flexible Options: Tailor essential parameters such as growth rates, WACC, and tax rates to fit your forecasts.
- Time Efficient: Pre-configured calculations save you from beginning with a blank slate.
- Professional-Quality Tool: Crafted for investors, analysts, and consultants alike.
- Easy to Use: Intuitive design and clear, step-by-step guidance make it accessible for everyone.
Who Should Utilize This Product?
- Investors: Accurately determine Medicover AB’s (0RPSL) fair value prior to making investment choices.
- CFOs: Employ a professional-grade DCF model for financial reporting and analysis tailored to Medicover AB (0RPSL).
- Consultants: Efficiently modify the template for valuation reports intended for clients of Medicover AB (0RPSL).
- Entrepreneurs: Acquire insights into financial modeling practices used by leading health care companies like Medicover AB (0RPSL).
- Educators: Utilize it as a pedagogical resource to illustrate valuation techniques relevant to Medicover AB (0RPSL).
Contents of the Template
- Preloaded MDCO Data: Historical and projected financial information, encompassing revenue, EBIT, and capital expenditures.
- DCF and WACC Models: Advanced spreadsheets designed for calculating intrinsic value and Weighted Average Cost of Capital.
- Editable Inputs: Cells highlighted in yellow for modifying revenue growth, tax rates, and discount rates.
- Financial Statements: Detailed annual and quarterly financials for in-depth analysis.
- Key Ratios: Ratios related to profitability, leverage, and efficiency for performance assessment.
- Dashboard and Charts: Visual representations of valuation results and underlying assumptions.
Disclaimer
All information, articles, and product details provided on this website are for general informational and educational purposes only. We do not claim any ownership over, nor do we intend to infringe upon, any trademarks, copyrights, logos, brand names, or other intellectual property mentioned or depicted on this site. Such intellectual property remains the property of its respective owners, and any references here are made solely for identification or informational purposes, without implying any affiliation, endorsement, or partnership.
We make no representations or warranties, express or implied, regarding the accuracy, completeness, or suitability of any content or products presented. Nothing on this website should be construed as legal, tax, investment, financial, medical, or other professional advice. In addition, no part of this site—including articles or product references—constitutes a solicitation, recommendation, endorsement, advertisement, or offer to buy or sell any securities, franchises, or other financial instruments, particularly in jurisdictions where such activity would be unlawful.
All content is of a general nature and may not address the specific circumstances of any individual or entity. It is not a substitute for professional advice or services. Any actions you take based on the information provided here are strictly at your own risk. You accept full responsibility for any decisions or outcomes arising from your use of this website and agree to release us from any liability in connection with your use of, or reliance upon, the content or products found herein.