
|
Seazen Group Limited (1030.HK) DCF Valuation |
Fully Editable: Tailor To Your Needs In Excel Or Sheets
Professional Design: Trusted, Industry-Standard Templates
Investor-Approved Valuation Models
MAC/PC Compatible, Fully Unlocked
No Expertise Is Needed; Easy To Follow
Seazen Group Limited (1030.HK) Bundle
Designed for accuracy, our (1030HK) DCF Calculator enables you to evaluate Seazen Group Limited's valuation using real-world financial data and offers complete flexibility to modify all essential parameters for enhanced projections.
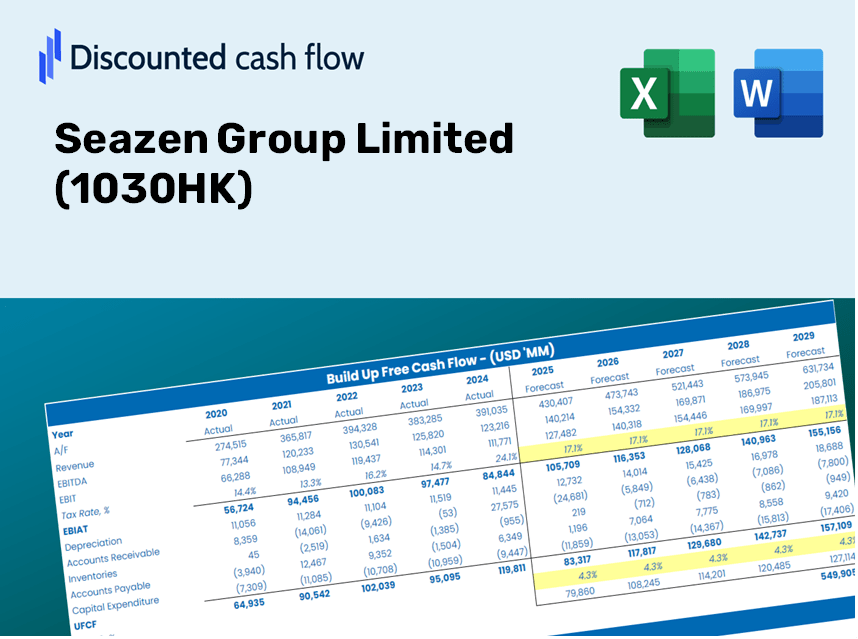
Discounted Cash Flow (DCF) - (USD MM)
| Year | AY1 2020 |
AY2 2021 |
AY3 2022 |
AY4 2023 |
AY5 2024 |
FY1 2025 |
FY2 2026 |
FY3 2027 |
FY4 2028 |
FY5 2029 |
|---|---|---|---|---|---|---|---|---|---|---|
| Revenue | 159,779.9 | 185,388.0 | 127,436.4 | 130,632.6 | 97,568.6 | 88,291.1 | 79,895.7 | 72,298.6 | 65,423.8 | 59,202.8 |
| Revenue Growth, % | 0 | 16.03 | -31.26 | 2.51 | -25.31 | -9.51 | -9.51 | -9.51 | -9.51 | -9.51 |
| EBITDA | 24,303.1 | 19,546.9 | 6,169.8 | 8,564.7 | 7,688.5 | 7,951.8 | 7,195.7 | 6,511.5 | 5,892.3 | 5,332.0 |
| EBITDA, % | 15.21 | 10.54 | 4.84 | 6.56 | 7.88 | 9.01 | 9.01 | 9.01 | 9.01 | 9.01 |
| Depreciation | 693.6 | 683.2 | 648.4 | 697.8 | 228.6 | 367.3 | 332.3 | 300.7 | 272.1 | 246.3 |
| Depreciation, % | 0.43408 | 0.36854 | 0.50881 | 0.53414 | 0.23429 | 0.41597 | 0.41597 | 0.41597 | 0.41597 | 0.41597 |
| EBIT | 23,609.5 | 18,863.7 | 5,521.4 | 7,866.9 | 7,459.9 | 7,584.6 | 6,863.4 | 6,210.8 | 5,620.2 | 5,085.8 |
| EBIT, % | 14.78 | 10.18 | 4.33 | 6.02 | 7.65 | 8.59 | 8.59 | 8.59 | 8.59 | 8.59 |
| Total Cash | 67,015.4 | 53,410.3 | 26,390.3 | 15,105.3 | 8,169.1 | 19,670.7 | 17,800.2 | 16,107.6 | 14,576.0 | 13,190.0 |
| Total Cash, percent | .0 | .0 | .0 | .0 | .0 | .0 | .0 | .0 | .0 | .0 |
| Account Receivables | 76,882.3 | 84,336.8 | 67,268.3 | 55,690.5 | 46,327.7 | 41,763.3 | 37,792.1 | 34,198.5 | 30,946.7 | 28,004.0 |
| Account Receivables, % | 48.12 | 45.49 | 52.79 | 42.63 | 47.48 | 47.3 | 47.3 | 47.3 | 47.3 | 47.3 |
| Inventories | 295,917.6 | 273,792.4 | 223,524.0 | 155,857.2 | 106,101.5 | 88,291.1 | 79,895.7 | 72,298.6 | 65,423.8 | 59,202.8 |
| Inventories, % | 185.2 | 147.69 | 175.4 | 119.31 | 108.75 | 100 | 100 | 100 | 100 | 100 |
| Accounts Payable | 63,843.4 | 65,970.9 | 55,305.2 | 52,992.2 | 97,104.1 | 45,740.1 | 41,390.8 | 37,455.1 | 33,893.5 | 30,670.7 |
| Accounts Payable, % | 39.96 | 35.59 | 43.4 | 40.57 | 99.52 | 51.81 | 51.81 | 51.81 | 51.81 | 51.81 |
| Capital Expenditure | -1,319.4 | -1,604.5 | -1,262.6 | -307.5 | -54.0 | -524.9 | -475.0 | -429.8 | -389.0 | -352.0 |
| Capital Expenditure, % | -0.82579 | -0.86549 | -0.99076 | -0.23538 | -0.05531315 | -0.59455 | -0.59455 | -0.59455 | -0.59455 | -0.59455 |
| Tax Rate, % | 88.29 | 88.29 | 88.29 | 88.29 | 88.29 | 88.29 | 88.29 | 88.29 | 88.29 | 88.29 |
| EBITAT | 9,107.4 | 7,573.5 | 419.5 | 1,378.0 | 873.9 | 1,752.8 | 1,586.2 | 1,435.3 | 1,298.9 | 1,175.3 |
| Depreciation | ||||||||||
| Changes in Account Receivables | ||||||||||
| Changes in Inventories | ||||||||||
| Changes in Accounts Payable | ||||||||||
| Capital Expenditure | ||||||||||
| UFCF | -300,475.0 | 23,450.4 | 56,476.4 | 78,699.9 | 104,278.9 | -27,393.9 | 9,460.7 | 8,561.1 | 7,747.1 | 7,010.4 |
| WACC, % | 4.23 | 4.29 | 3.06 | 3.44 | 3.22 | 3.65 | 3.65 | 3.65 | 3.65 | 3.65 |
| PV UFCF | ||||||||||
| SUM PV UFCF | 2,640.3 | |||||||||
| Long Term Growth Rate, % | 2.00 | |||||||||
| Free cash flow (T + 1) | 7,151 | |||||||||
| Terminal Value | 434,532 | |||||||||
| Present Terminal Value | 363,302 | |||||||||
| Enterprise Value | 365,942 | |||||||||
| Net Debt | 57,019 | |||||||||
| Equity Value | 308,924 | |||||||||
| Diluted Shares Outstanding, MM | 7,044 | |||||||||
| Equity Value Per Share | 43.86 |
What You Will Receive
- Accurate Seazen Financials: Access historical and projected data for precise valuation.
- Customizable Inputs: Adjust WACC, tax rates, revenue growth, and capital expenditures as needed.
- Automatic Calculations: Intrinsic value and NPV are computed in real-time.
- Scenario Analysis: Explore various scenarios to assess Seazen Group Limited's (1030HK) future performance.
- User-Friendly Interface: Designed for professionals but also easy to navigate for novices.
Key Features
- Real-Time 1030HK Data: Pre-loaded with Seazen Group's historical financial performance and forward-looking estimates.
- Completely Customizable Variables: Modify projections for revenue growth, profit margins, WACC, tax rates, and capital expenditures.
- Adaptive Valuation Model: Automatically refreshes Net Present Value (NPV) and intrinsic value based on your inputs.
- Scenario Analysis: Generate multiple forecasting scenarios to examine various valuation possibilities.
- Intuitive User Interface: Designed to be simple and organized, catering to both professionals and novices.
How It Operates
- Obtain the Template: Gain immediate access to the Excel-based Seazen Group Limited (1030HK) DCF Calculator.
- Enter Your Assumptions: Modify the yellow-highlighted cells for growth rates, WACC, profit margins, and additional parameters.
- Automatic Calculations: The model instantly recalculates the intrinsic value of Seazen Group Limited (1030HK).
- Evaluate Scenarios: Test various assumptions to see how they impact potential valuations.
- Review and Decide: Utilize the findings to inform your investment or financial evaluations.
Why Opt for the Seazen Group Limited (1030HK) Calculator?
- Precision: Utilizes real financial data from Seazen Group for optimal accuracy.
- Versatility: Tailored for users to easily adjust and experiment with inputs.
- Efficiency: Eliminate the need to construct a DCF model from the ground up.
- High-Quality: Built with the precision and user-friendliness expected by CFOs.
- Accessible: Intuitive design makes it suitable for users with varying levels of financial expertise.
Who Can Benefit from Seazen Group Limited (1030HK)?
- Investors: Utilize a high-quality valuation tool to make informed investment choices.
- Financial Analysts: Accelerate your analysis process with a customizable DCF model at your fingertips.
- Consultants: Effortlessly modify the template for impactful client presentations or reports.
- Finance Enthusiasts: Enhance your knowledge of valuation strategies through practical, real-world examples.
- Educators and Students: Leverage this resource as a hands-on learning aid in finance courses.
Contents of the Template
- Pre-Filled DCF Model: Seazen Group Limited’s financial data preloaded for immediate analysis.
- WACC Calculator: Comprehensive calculations for Weighted Average Cost of Capital.
- Financial Ratios: Assess Seazen Group Limited’s profitability, leverage, and operational efficiency.
- Editable Inputs: Adjust key assumptions such as growth rates, margins, and CAPEX to tailor the model to your needs.
- Financial Statements: Annual and quarterly reports provided for thorough examination.
- Interactive Dashboard: Effortlessly visualize critical valuation metrics and outcomes.
Disclaimer
All information, articles, and product details provided on this website are for general informational and educational purposes only. We do not claim any ownership over, nor do we intend to infringe upon, any trademarks, copyrights, logos, brand names, or other intellectual property mentioned or depicted on this site. Such intellectual property remains the property of its respective owners, and any references here are made solely for identification or informational purposes, without implying any affiliation, endorsement, or partnership.
We make no representations or warranties, express or implied, regarding the accuracy, completeness, or suitability of any content or products presented. Nothing on this website should be construed as legal, tax, investment, financial, medical, or other professional advice. In addition, no part of this site—including articles or product references—constitutes a solicitation, recommendation, endorsement, advertisement, or offer to buy or sell any securities, franchises, or other financial instruments, particularly in jurisdictions where such activity would be unlawful.
All content is of a general nature and may not address the specific circumstances of any individual or entity. It is not a substitute for professional advice or services. Any actions you take based on the information provided here are strictly at your own risk. You accept full responsibility for any decisions or outcomes arising from your use of this website and agree to release us from any liability in connection with your use of, or reliance upon, the content or products found herein.