
|
Hengan International Group Company Limited (1044.HK) DCF Valuation |
Fully Editable: Tailor To Your Needs In Excel Or Sheets
Professional Design: Trusted, Industry-Standard Templates
Investor-Approved Valuation Models
MAC/PC Compatible, Fully Unlocked
No Expertise Is Needed; Easy To Follow
Hengan International Group Company Limited (1044.HK) Bundle
Explore the financial future of Hengan International Group Company Limited (1044HK) with our user-friendly DCF Calculator! Enter your projections for growth, margins, and expenses to determine the intrinsic value of Hengan International Group Company Limited (1044HK) and refine your investment strategy.
What You'll Receive
- Genuine Hengan Data: Preloaded financial metrics – encompassing everything from revenue to EBIT – based on real and projected figures.
- Complete Customization: Modify all key parameters (yellow cells) such as WACC, growth %, and tax rates to fit your analysis.
- Immediate Valuation Updates: Automatic recalculations to evaluate the implications of changes on Hengan’s fair value.
- Flexible Excel Template: Designed for quick modifications, scenario analysis, and comprehensive projections.
- Efficient and Accurate: Eliminate the need to build models from scratch while ensuring precision and adaptability.
Key Features
- Advanced DCF Calculator: Offers comprehensive unlevered and levered DCF valuation models tailored for Hengan International Group Company Limited (1044HK).
- WACC Calculator: Comes with a pre-structured Weighted Average Cost of Capital sheet that allows for customizable inputs specific to Hengan International Group Company Limited (1044HK).
- Editable Forecast Assumptions: Adjust growth rates, capital expenditures, and discount rates to fit your analysis of Hengan International Group Company Limited (1044HK).
- Built-In Financial Ratios: Evaluate profitability, leverage, and efficiency ratios relevant to Hengan International Group Company Limited (1044HK).
- Dashboard and Charts: Visual representations summarize key valuation metrics, facilitating straightforward analysis for Hengan International Group Company Limited (1044HK).
How It Operates
- Download: Obtain the pre-built Excel file featuring Hengan International Group Company Limited’s (1044HK) financial data.
- Customize: Modify forecasts such as revenue growth, EBITDA %, and WACC to fit your analysis.
- Update Automatically: Watch as intrinsic value and NPV calculations refresh in real-time.
- Test Scenarios: Generate multiple projections and compare results with ease.
- Make Decisions: Leverage the valuation insights to inform your investment strategy.
Why Select Hengan International Group Company Limited (1044HK) Calculator?
- Time-Efficient: Skip the hassle of building a DCF model from the ground up – it’s ready for immediate use.
- Enhanced Accuracy: Dependable financial data and calculations minimize valuation errors.
- Completely Customizable: Adjust the model to align with your assumptions and forecasts.
- User-Friendly: Intuitive charts and outputs simplify the analysis of results.
- Endorsed by Professionals: Crafted for experts who prioritize precision and ease of use.
Who Can Benefit from This Product?
- Investors: Assess Hengan International Group’s valuation before making stock transactions.
- CFOs and Financial Analysts: Optimize valuation workflows and evaluate financial projections.
- Startup Founders: Gain insights into the valuation methods of prominent public companies like Hengan International Group (1044HK).
- Consultants: Produce comprehensive valuation reports for your clients.
- Students and Educators: Utilize real-world data to develop and teach valuation skills.
Contents of the Template
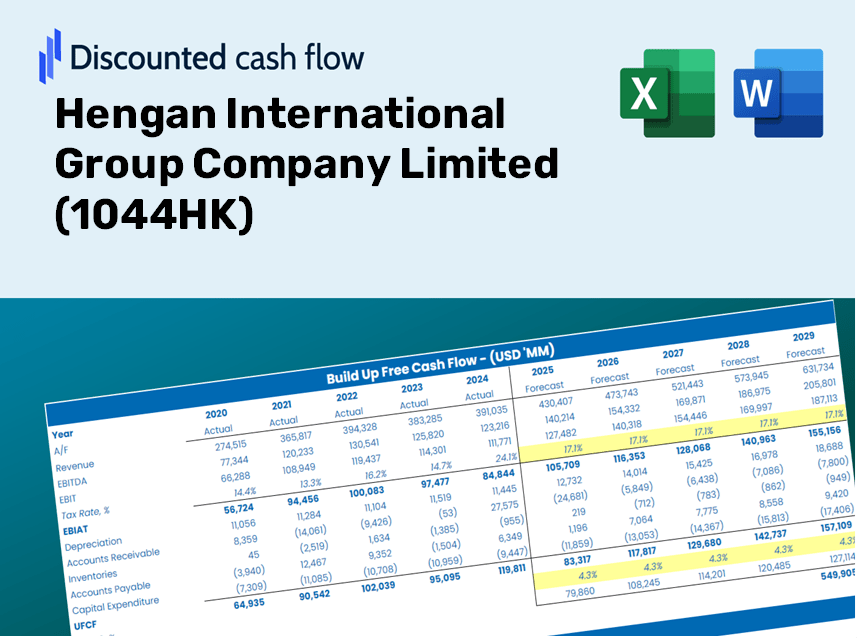
- Operating and Balance Sheet Data: Pre-filled historical data and forecasts for Hengan International Group Company Limited (1044HK), including revenue, EBITDA, EBIT, and capital expenditures.
- WACC Calculation: A dedicated sheet for the Weighted Average Cost of Capital (WACC), incorporating parameters such as Beta, risk-free rate, and share price.
- DCF Valuation (Unlevered and Levered): Customizable Discounted Cash Flow models that reveal intrinsic value with comprehensive calculations.
- Financial Statements: Pre-loaded annual and quarterly financial statements to facilitate thorough analysis.
- Key Ratios: Features profitability, leverage, and efficiency ratios specific to Hengan International Group Company Limited (1044HK).
- Dashboard and Charts: A visual summary of valuation results and assumptions for easy result analysis.
Disclaimer
All information, articles, and product details provided on this website are for general informational and educational purposes only. We do not claim any ownership over, nor do we intend to infringe upon, any trademarks, copyrights, logos, brand names, or other intellectual property mentioned or depicted on this site. Such intellectual property remains the property of its respective owners, and any references here are made solely for identification or informational purposes, without implying any affiliation, endorsement, or partnership.
We make no representations or warranties, express or implied, regarding the accuracy, completeness, or suitability of any content or products presented. Nothing on this website should be construed as legal, tax, investment, financial, medical, or other professional advice. In addition, no part of this site—including articles or product references—constitutes a solicitation, recommendation, endorsement, advertisement, or offer to buy or sell any securities, franchises, or other financial instruments, particularly in jurisdictions where such activity would be unlawful.
All content is of a general nature and may not address the specific circumstances of any individual or entity. It is not a substitute for professional advice or services. Any actions you take based on the information provided here are strictly at your own risk. You accept full responsibility for any decisions or outcomes arising from your use of this website and agree to release us from any liability in connection with your use of, or reliance upon, the content or products found herein.