
|
China Southern Airlines Company Limited (1055.HK) DCF Valuation |
Fully Editable: Tailor To Your Needs In Excel Or Sheets
Professional Design: Trusted, Industry-Standard Templates
Investor-Approved Valuation Models
MAC/PC Compatible, Fully Unlocked
No Expertise Is Needed; Easy To Follow
China Southern Airlines Company Limited (1055.HK) Bundle
Explore the financial prospects of China Southern Airlines Company Limited (1055HK) with our user-friendly DCF Calculator! Enter your assumptions regarding growth, margins, and costs to calculate the intrinsic value of China Southern Airlines Company Limited (1055HK) and enhance your investment approach.
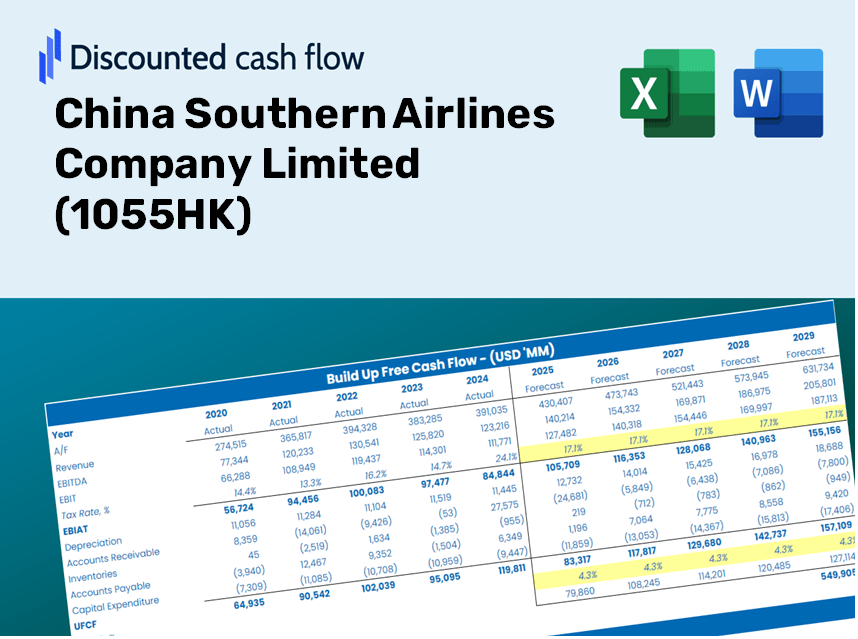
Discounted Cash Flow (DCF) - (USD MM)
| Year | AY1 2020 |
AY2 2021 |
AY3 2022 |
AY4 2023 |
AY5 2024 |
FY1 2025 |
FY2 2026 |
FY3 2027 |
FY4 2028 |
FY5 2029 |
|---|---|---|---|---|---|---|---|---|---|---|
| Revenue | 101,137.5 | 111,062.1 | 95,125.7 | 174,747.6 | 190,367.1 | 232,297.4 | 283,463.3 | 345,899.0 | 422,086.8 | 515,055.7 |
| Revenue Growth, % | 0 | 9.81 | -14.35 | 83.7 | 8.94 | 22.03 | 22.03 | 22.03 | 22.03 | 22.03 |
| EBITDA | 15,347.5 | 15,192.3 | -5,853.4 | 30,259.0 | 35,352.9 | 27,219.4 | 33,214.8 | 40,530.7 | 49,457.9 | 60,351.6 |
| EBITDA, % | 15.17 | 13.68 | -6.15 | 17.32 | 18.57 | 11.72 | 11.72 | 11.72 | 11.72 | 11.72 |
| Depreciation | 26,668.5 | 26,264.2 | 26,270.8 | 29,512.7 | 30,854.5 | 51,444.7 | 62,776.0 | 76,603.0 | 93,475.6 | 114,064.6 |
| Depreciation, % | 26.37 | 23.65 | 27.62 | 16.89 | 16.21 | 22.15 | 22.15 | 22.15 | 22.15 | 22.15 |
| EBIT | -11,321.0 | -11,071.9 | -32,124.1 | 746.3 | 4,498.5 | -24,225.3 | -29,561.2 | -36,072.4 | -44,017.7 | -53,713.0 |
| EBIT, % | -11.19 | -9.97 | -33.77 | 0.42706 | 2.36 | -10.43 | -10.43 | -10.43 | -10.43 | -10.43 |
| Total Cash | 27,774.3 | 23,444.1 | 21,731.9 | 14,293.1 | 20,420.7 | 41,963.4 | 51,206.3 | 62,485.0 | 76,247.9 | 93,042.3 |
| Total Cash, percent | .0 | .0 | .0 | .0 | .0 | .0 | .0 | .0 | .0 | .0 |
| Account Receivables | 2,792.8 | 3,317.3 | 3,068.2 | 3,828.7 | 7,165.6 | 6,935.8 | 8,463.5 | 10,327.7 | 12,602.5 | 15,378.3 |
| Account Receivables, % | 2.76 | 2.99 | 3.23 | 2.19 | 3.76 | 2.99 | 2.99 | 2.99 | 2.99 | 2.99 |
| Inventories | 1,923.1 | 1,805.1 | 1,515.5 | 1,710.0 | 2,187.5 | 3,367.2 | 4,108.8 | 5,013.8 | 6,118.2 | 7,465.8 |
| Inventories, % | 1.9 | 1.63 | 1.59 | 0.97856 | 1.15 | 1.45 | 1.45 | 1.45 | 1.45 | 1.45 |
| Accounts Payable | 1,889.2 | 1,491.5 | 2,158.0 | 2,720.7 | 21,393.1 | 8,490.1 | 10,360.1 | 12,642.1 | 15,426.6 | 18,824.5 |
| Accounts Payable, % | 1.87 | 1.34 | 2.27 | 1.56 | 11.24 | 3.65 | 3.65 | 3.65 | 3.65 | 3.65 |
| Capital Expenditure | -12,085.9 | -18,724.9 | -12,779.7 | -12,422.4 | -17,634.4 | -27,232.9 | -33,231.3 | -40,550.8 | -49,482.5 | -60,381.5 |
| Capital Expenditure, % | -11.95 | -16.86 | -13.43 | -7.11 | -9.26 | -11.72 | -11.72 | -11.72 | -11.72 | -11.72 |
| Tax Rate, % | 207.27 | 207.27 | 207.27 | 207.27 | 207.27 | 207.27 | 207.27 | 207.27 | 207.27 | 207.27 |
| EBITAT | -8,811.7 | -8,768.4 | -34,329.5 | 1,909.5 | -4,825.7 | -17,298.3 | -21,108.4 | -25,757.8 | -31,431.2 | -38,354.3 |
| Depreciation | ||||||||||
| Changes in Account Receivables | ||||||||||
| Changes in Inventories | ||||||||||
| Changes in Accounts Payable | ||||||||||
| Capital Expenditure | ||||||||||
| UFCF | 2,944.2 | -2,033.2 | -19,633.3 | 18,607.5 | 23,252.3 | -6,939.4 | 8,036.9 | 9,807.2 | 11,967.3 | 14,603.2 |
| WACC, % | 3.55 | 3.58 | 4.11 | 4.11 | 1.59 | 3.39 | 3.39 | 3.39 | 3.39 | 3.39 |
| PV UFCF | ||||||||||
| SUM PV UFCF | 32,518.6 | |||||||||
| Long Term Growth Rate, % | 2.00 | |||||||||
| Free cash flow (T + 1) | 14,895 | |||||||||
| Terminal Value | 1,073,815 | |||||||||
| Present Terminal Value | 909,069 | |||||||||
| Enterprise Value | 941,588 | |||||||||
| Net Debt | 169,875 | |||||||||
| Equity Value | 771,712 | |||||||||
| Diluted Shares Outstanding, MM | 18,121 | |||||||||
| Equity Value Per Share | 42.59 |
What You Will Receive
- Customizable Excel Template: A tailored Excel-based DCF Calculator featuring pre-loaded real financial data for China Southern Airlines (1055HK).
- Actual Market Data: Access to historical data and projected estimates (highlighted in the yellow cells).
- Flexible Forecasting: Adjust forecast parameters such as revenue growth, EBITDA %, and WACC.
- Instant Calculations: Quickly observe how your inputs influence the valuation of China Southern Airlines (1055HK).
- Professional Tool: Designed for investors, CFOs, consultants, and financial analysts.
- User-Friendly Interface: Organized for clarity and ease of navigation, complete with step-by-step guidance.
Key Features
- Customizable Forecast Parameters: Adjust essential inputs such as passenger traffic growth, yield %, and operating expenses.
- Instant DCF Valuation: Quickly computes intrinsic value, NPV, and additional metrics.
- High-Precision Accuracy: Utilizes China Southern Airlines' real financial data for credible valuation results.
- Effortless Scenario Analysis: Easily explore various assumptions and assess different outcomes.
- Efficiency Booster: Remove the hassle of creating intricate valuation models from the ground up.
How It Works
- Step 1: Download the Excel file.
- Step 2: Examine the pre-filled data for China Southern Airlines Company Limited (1055HK) including historical and projected figures.
- Step 3: Modify key assumptions (highlighted in yellow) based on your analysis.
- Step 4: Observe the automatic recalculations for the intrinsic value of China Southern Airlines Company Limited (1055HK).
- Step 5: Utilize the results for your investment analysis or reporting needs.
Why Choose This Calculator for China Southern Airlines (1055HK)?
- Precision: Leveraging genuine financial data for enhanced accuracy.
- Adaptability: Tailored for users to explore and adjust inputs as needed.
- Efficiency: Eliminate the complexity of constructing a DCF model from the ground up.
- Expert-Level: Crafted with the insight and usability standards expected by CFOs.
- Intuitive: Simple to navigate, making it accessible even for individuals without extensive financial modeling expertise.
Who Should Use This Product?
- Professional Investors: Develop comprehensive and accurate valuation models for analyzing portfolios involving China Southern Airlines (1055HK).
- Corporate Finance Teams: Evaluate valuation scenarios to inform strategic decisions for the organization.
- Consultants and Advisors: Deliver precise valuation insights to clients interested in China Southern Airlines (1055HK) stock.
- Students and Educators: Utilize real-world data to enhance financial modeling practices and instruction.
- Aviation Enthusiasts: Gain insights into how airline companies like China Southern Airlines (1055HK) are valued in the marketplace.
Contents of the Template
- Comprehensive DCF Model: An editable template featuring detailed valuation calculations.
- Real-World Data: Historical and projected financials for China Southern Airlines Company Limited (1055HK) preloaded for analysis.
- Customizable Parameters: Modify WACC, growth rates, and tax assumptions to explore different scenarios.
- Financial Statements: Complete annual and quarterly breakdowns for enhanced insights.
- Key Ratios: Integrated analysis tools for assessing profitability, efficiency, and leverage.
- Dashboard with Visual Outputs: Charts and tables designed for clear, actionable insights.
Disclaimer
All information, articles, and product details provided on this website are for general informational and educational purposes only. We do not claim any ownership over, nor do we intend to infringe upon, any trademarks, copyrights, logos, brand names, or other intellectual property mentioned or depicted on this site. Such intellectual property remains the property of its respective owners, and any references here are made solely for identification or informational purposes, without implying any affiliation, endorsement, or partnership.
We make no representations or warranties, express or implied, regarding the accuracy, completeness, or suitability of any content or products presented. Nothing on this website should be construed as legal, tax, investment, financial, medical, or other professional advice. In addition, no part of this site—including articles or product references—constitutes a solicitation, recommendation, endorsement, advertisement, or offer to buy or sell any securities, franchises, or other financial instruments, particularly in jurisdictions where such activity would be unlawful.
All content is of a general nature and may not address the specific circumstances of any individual or entity. It is not a substitute for professional advice or services. Any actions you take based on the information provided here are strictly at your own risk. You accept full responsibility for any decisions or outcomes arising from your use of this website and agree to release us from any liability in connection with your use of, or reliance upon, the content or products found herein.