
|
Zhejiang Shibao Company Limited (1057.HK) DCF Valuation |
Fully Editable: Tailor To Your Needs In Excel Or Sheets
Professional Design: Trusted, Industry-Standard Templates
Investor-Approved Valuation Models
MAC/PC Compatible, Fully Unlocked
No Expertise Is Needed; Easy To Follow
Zhejiang Shibao Company Limited (1057.HK) Bundle
Evaluate the financial prospects of Zhejiang Shibao Company Limited like an expert! This (1057HK) DCF Calculator provides you with pre-filled financials and the flexibility to modify revenue growth, WACC, margins, and other essential assumptions to align with your forecasts.
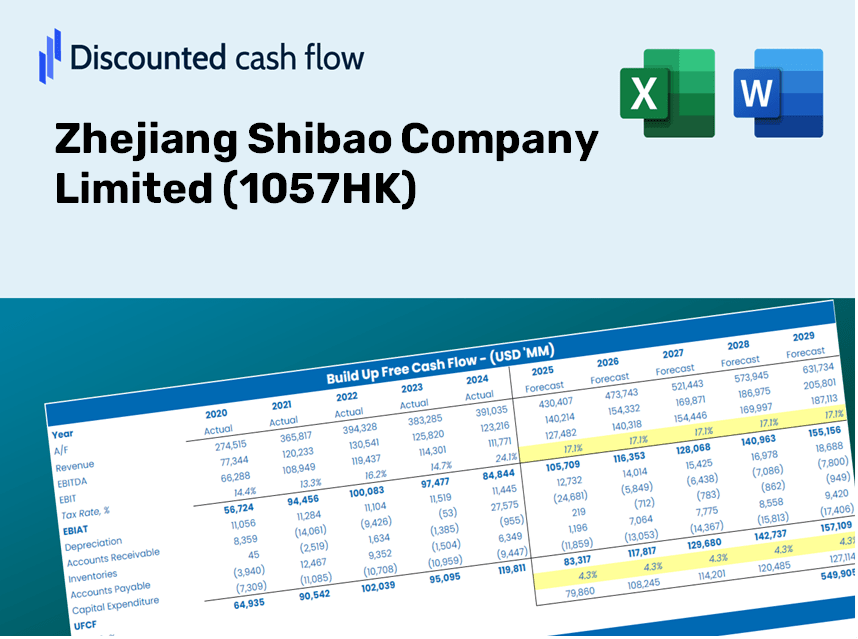
Discounted Cash Flow (DCF) - (USD MM)
| Year | AY1 2020 |
AY2 2021 |
AY3 2022 |
AY4 2023 |
AY5 2024 |
FY1 2025 |
FY2 2026 |
FY3 2027 |
FY4 2028 |
FY5 2029 |
|---|---|---|---|---|---|---|---|---|---|---|
| Revenue | 1,204.2 | 1,287.1 | 1,514.9 | 1,988.0 | 2,943.0 | 3,707.1 | 4,669.6 | 5,881.9 | 7,409.0 | 9,332.5 |
| Revenue Growth, % | 0 | 6.88 | 17.7 | 31.24 | 48.04 | 25.96 | 25.96 | 25.96 | 25.96 | 25.96 |
| EBITDA | 140.4 | 125.8 | 116.8 | 199.4 | 272.4 | 359.1 | 452.3 | 569.7 | 717.6 | 903.9 |
| EBITDA, % | 11.66 | 9.77 | 7.71 | 10.03 | 9.26 | 9.69 | 9.69 | 9.69 | 9.69 | 9.69 |
| Depreciation | 95.6 | 90.2 | 90.6 | 99.6 | 101.6 | 217.9 | 274.4 | 345.7 | 435.4 | 548.4 |
| Depreciation, % | 7.94 | 7 | 5.98 | 5.01 | 3.45 | 5.88 | 5.88 | 5.88 | 5.88 | 5.88 |
| EBIT | 44.9 | 35.6 | 26.2 | 99.7 | 170.9 | 141.2 | 177.9 | 224.0 | 282.2 | 355.5 |
| EBIT, % | 3.72 | 2.77 | 1.73 | 5.02 | 5.81 | 3.81 | 3.81 | 3.81 | 3.81 | 3.81 |
| Total Cash | 182.8 | 290.9 | 385.3 | 293.6 | 534.2 | 712.8 | 897.8 | 1,130.9 | 1,424.5 | 1,794.4 |
| Total Cash, percent | .0 | .0 | .0 | .0 | .0 | .0 | .0 | .0 | .0 | .0 |
| Account Receivables | 560.7 | 517.4 | 646.4 | .0 | 1,380.8 | 1,307.5 | 1,647.0 | 2,074.5 | 2,613.1 | 3,291.6 |
| Account Receivables, % | 46.56 | 40.2 | 42.67 | 0 | 46.92 | 35.27 | 35.27 | 35.27 | 35.27 | 35.27 |
| Inventories | 277.9 | 359.6 | 457.7 | 522.5 | 548.4 | 935.4 | 1,178.2 | 1,484.1 | 1,869.4 | 2,354.7 |
| Inventories, % | 23.08 | 27.94 | 30.22 | 26.28 | 18.63 | 25.23 | 25.23 | 25.23 | 25.23 | 25.23 |
| Accounts Payable | 442.9 | 468.7 | 757.2 | 922.4 | 1,137.6 | 1,543.9 | 1,944.7 | 2,449.6 | 3,085.6 | 3,886.7 |
| Accounts Payable, % | 36.78 | 36.42 | 49.99 | 46.4 | 38.65 | 41.65 | 41.65 | 41.65 | 41.65 | 41.65 |
| Capital Expenditure | -102.5 | -85.3 | -84.5 | -69.5 | -110.7 | -207.4 | -261.2 | -329.0 | -414.4 | -522.0 |
| Capital Expenditure, % | -8.51 | -6.63 | -5.58 | -3.49 | -3.76 | -5.59 | -5.59 | -5.59 | -5.59 | -5.59 |
| Tax Rate, % | 2.07 | 2.07 | 2.07 | 2.07 | 2.07 | 2.07 | 2.07 | 2.07 | 2.07 | 2.07 |
| EBITAT | 50.7 | 32.9 | 22.3 | 91.7 | 167.4 | 131.9 | 166.2 | 209.3 | 263.7 | 332.1 |
| Depreciation | ||||||||||
| Changes in Account Receivables | ||||||||||
| Changes in Inventories | ||||||||||
| Changes in Accounts Payable | ||||||||||
| Capital Expenditure | ||||||||||
| UFCF | -351.9 | 25.1 | 89.7 | 868.7 | -1,033.2 | 235.1 | -2.1 | -2.6 | -3.3 | -4.1 |
| WACC, % | 8.35 | 8.34 | 8.34 | 8.34 | 8.35 | 8.34 | 8.34 | 8.34 | 8.34 | 8.34 |
| PV UFCF | ||||||||||
| SUM PV UFCF | 208.1 | |||||||||
| Long Term Growth Rate, % | 2.00 | |||||||||
| Free cash flow (T + 1) | -4 | |||||||||
| Terminal Value | -66 | |||||||||
| Present Terminal Value | -44 | |||||||||
| Enterprise Value | 164 | |||||||||
| Net Debt | -369 | |||||||||
| Equity Value | 533 | |||||||||
| Diluted Shares Outstanding, MM | 2,057 | |||||||||
| Equity Value Per Share | 0.26 |
Benefits You Will Receive
- Authentic 1057HK Financial Data: Loaded with Zhejiang Shibao's historical and projected figures for in-depth analysis.
- Customizable Template: Effortlessly adjust essential inputs such as revenue growth, WACC, and EBITDA percentages.
- Instant Calculations: Watch as the intrinsic value for Zhejiang Shibao updates in real-time with your modifications.
- Expert Valuation Instrument: Tailored for investors, analysts, and consultants aiming for precise DCF evaluations.
- Intuitive Layout: Featuring a straightforward design and clear guidance suitable for all levels of expertise.
Key Features
- 🔍 Real-Life ZHSH Financials: Pre-filled historical and projected data for Zhejiang Shibao Company Limited (1057HK).
- ✏️ Fully Customizable Inputs: Modify all essential parameters (yellow cells) such as WACC, growth %, and tax rates.
- 📊 Professional DCF Valuation: Integrated formulas assess Zhejiang Shibao's intrinsic value using the Discounted Cash Flow approach.
- ⚡ Instant Results: Visualize Zhejiang Shibao's valuation immediately after adjustments are made.
- Scenario Analysis: Evaluate and compare outcomes for different financial scenarios side-by-side.
How It Functions
- Download: Obtain the pre-configured Excel file containing Zhejiang Shibao Company Limited’s financial data.
- Customize: Tailor forecasts by modifying parameters such as revenue growth, EBITDA %, and WACC.
- Update Automatically: Real-time updates for the intrinsic value and NPV calculations as you make changes.
- Test Scenarios: Generate various projections and instantly compare different outcomes.
- Make Decisions: Leverage the valuation insights to inform your investment strategies.
Why Select This Calculator for Zhejiang Shibao Company Limited (1057HK)?
- Designed for Industry Experts: A sophisticated tool utilized by financial analysts, CFOs, and consultants.
- Accurate Historical Data: Comprehensive financial data for Zhejiang Shibao preloaded for precise analysis.
- Flexible Scenario Analysis: Easily test various forecasts and assumptions to explore different outcomes.
- Intuitive Outputs: Automatically computes intrinsic value, NPV, and essential financial metrics.
- User-Friendly: Clear, step-by-step guidance to navigate the calculation process effortlessly.
Who Can Benefit from This Product?
- Investors: Evaluate Zhejiang Shibao Company Limited's (1057HK) valuation to make informed trading decisions.
- CFOs and Financial Analysts: Optimize valuation methodologies and assess financial forecasts for better insights.
- Startup Founders: Discover how public companies like Zhejiang Shibao Company Limited (1057HK) are appraised in the market.
- Consultants: Create detailed and accurate valuation reports for clients using Zhejiang Shibao Company Limited's (1057HK) data.
- Students and Educators: Utilize real-time data to practice and instruct on valuation strategies effectively.
What the Template Includes
- Operating and Balance Sheet Data: Pre-filled historical data and forecasts for Zhejiang Shibao Company Limited (1057HK), covering revenue, EBITDA, EBIT, and capital expenditures.
- WACC Calculation: A dedicated sheet for calculating the Weighted Average Cost of Capital (WACC), featuring inputs such as Beta, risk-free rate, and current share price.
- DCF Valuation (Unlevered and Levered): Customizable Discounted Cash Flow models that display intrinsic value alongside detailed calculations.
- Financial Statements: Pre-loaded annual and quarterly financial statements to facilitate comprehensive analysis.
- Key Ratios: Includes a range of profitability, leverage, and efficiency ratios relevant to Zhejiang Shibao Company Limited (1057HK).
- Dashboard and Charts: A visual summary of valuation results and underlying assumptions for straightforward analysis of outcomes.
Disclaimer
All information, articles, and product details provided on this website are for general informational and educational purposes only. We do not claim any ownership over, nor do we intend to infringe upon, any trademarks, copyrights, logos, brand names, or other intellectual property mentioned or depicted on this site. Such intellectual property remains the property of its respective owners, and any references here are made solely for identification or informational purposes, without implying any affiliation, endorsement, or partnership.
We make no representations or warranties, express or implied, regarding the accuracy, completeness, or suitability of any content or products presented. Nothing on this website should be construed as legal, tax, investment, financial, medical, or other professional advice. In addition, no part of this site—including articles or product references—constitutes a solicitation, recommendation, endorsement, advertisement, or offer to buy or sell any securities, franchises, or other financial instruments, particularly in jurisdictions where such activity would be unlawful.
All content is of a general nature and may not address the specific circumstances of any individual or entity. It is not a substitute for professional advice or services. Any actions you take based on the information provided here are strictly at your own risk. You accept full responsibility for any decisions or outcomes arising from your use of this website and agree to release us from any liability in connection with your use of, or reliance upon, the content or products found herein.