
|
TCL Electronics Holdings Limited (1070.HK) DCF Valuation |
Fully Editable: Tailor To Your Needs In Excel Or Sheets
Professional Design: Trusted, Industry-Standard Templates
Investor-Approved Valuation Models
MAC/PC Compatible, Fully Unlocked
No Expertise Is Needed; Easy To Follow
TCL Electronics Holdings Limited (1070.HK) Bundle
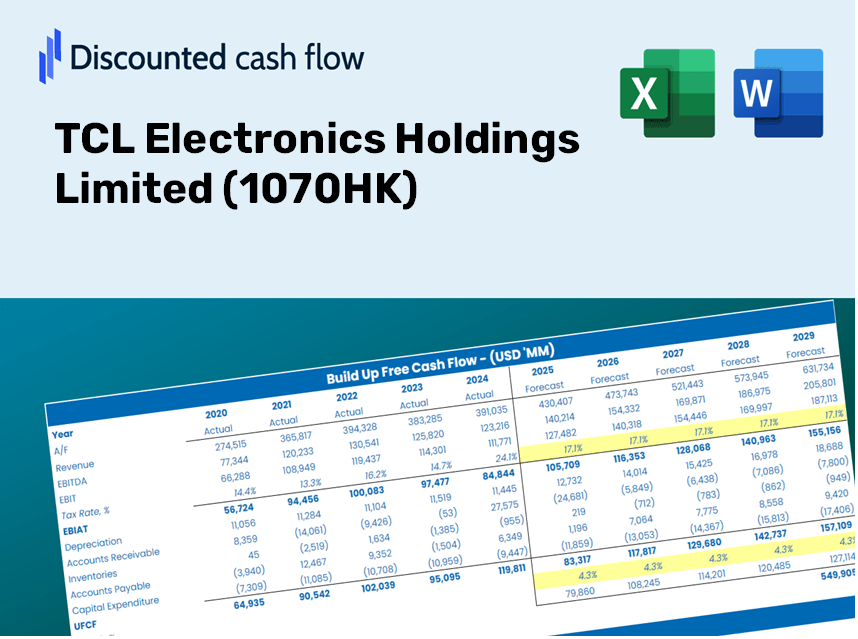
Designed for accuracy, our (1070HK) DCF Calculator enables you to assess TCL Electronics Holdings Limited's valuation using real-world financial data, offering complete flexibility to modify key parameters for improved projections.
Discounted Cash Flow (DCF) - (USD MM)
| Year | AY1 2020 |
AY2 2021 |
AY3 2022 |
AY4 2023 |
AY5 2024 |
FY1 2025 |
FY2 2026 |
FY3 2027 |
FY4 2028 |
FY5 2029 |
|---|---|---|---|---|---|---|---|---|---|---|
| Revenue | 50,952.9 | 74,846.9 | 71,351.4 | 78,986.1 | 99,322.3 | 99,109.2 | 98,896.4 | 98,684.2 | 98,472.4 | 98,261.0 |
| Revenue Growth, % | 0 | 46.89 | -4.67 | 10.7 | 25.75 | -0.21463 | -0.21463 | -0.21463 | -0.21463 | -0.21463 |
| EBITDA | 2,881.9 | 2,818.2 | 2,660.0 | 3,123.6 | 1,955.2 | 3,780.5 | 3,772.4 | 3,764.3 | 3,756.2 | 3,748.1 |
| EBITDA, % | 5.66 | 3.77 | 3.73 | 3.95 | 1.97 | 3.81 | 3.81 | 3.81 | 3.81 | 3.81 |
| Depreciation | 497.7 | 1,115.0 | 1,245.7 | 1,180.4 | 535.6 | 1,238.1 | 1,235.4 | 1,232.8 | 1,230.1 | 1,227.5 |
| Depreciation, % | 0.97676 | 1.49 | 1.75 | 1.49 | 0.53928 | 1.25 | 1.25 | 1.25 | 1.25 | 1.25 |
| EBIT | 2,384.2 | 1,703.2 | 1,414.4 | 1,943.2 | 1,419.5 | 2,542.4 | 2,537.0 | 2,531.5 | 2,526.1 | 2,520.7 |
| EBIT, % | 4.68 | 2.28 | 1.98 | 2.46 | 1.43 | 2.57 | 2.57 | 2.57 | 2.57 | 2.57 |
| Total Cash | 11,468.1 | 13,428.0 | 10,776.6 | 11,680.0 | 11,632.7 | 16,264.0 | 16,229.1 | 16,194.3 | 16,159.5 | 16,124.8 |
| Total Cash, percent | .0 | .0 | .0 | .0 | .0 | .0 | .0 | .0 | .0 | .0 |
| Account Receivables | 18,700.0 | 20,080.4 | 17,180.9 | 19,153.7 | 26,792.0 | 27,519.2 | 27,460.1 | 27,401.2 | 27,342.4 | 27,283.7 |
| Account Receivables, % | 36.7 | 26.83 | 24.08 | 24.25 | 26.97 | 27.77 | 27.77 | 27.77 | 27.77 | 27.77 |
| Inventories | 10,026.2 | 13,555.6 | 9,837.3 | 12,211.5 | 15,288.6 | 16,338.9 | 16,303.8 | 16,268.8 | 16,233.9 | 16,199.1 |
| Inventories, % | 19.68 | 18.11 | 13.79 | 15.46 | 15.39 | 16.49 | 16.49 | 16.49 | 16.49 | 16.49 |
| Accounts Payable | 17,468.9 | 19,425.5 | 18,946.8 | 24,008.2 | 32,485.8 | 29,711.9 | 29,648.2 | 29,584.5 | 29,521.0 | 29,457.7 |
| Accounts Payable, % | 34.28 | 25.95 | 26.55 | 30.4 | 32.71 | 29.98 | 29.98 | 29.98 | 29.98 | 29.98 |
| Capital Expenditure | -904.6 | -1,371.8 | -959.1 | -575.5 | -525.1 | -1,230.8 | -1,228.2 | -1,225.6 | -1,222.9 | -1,220.3 |
| Capital Expenditure, % | -1.78 | -1.83 | -1.34 | -0.72857 | -0.52872 | -1.24 | -1.24 | -1.24 | -1.24 | -1.24 |
| Tax Rate, % | 30.03 | 30.03 | 30.03 | 30.03 | 30.03 | 30.03 | 30.03 | 30.03 | 30.03 | 30.03 |
| EBITAT | 4,127.2 | 1,392.9 | 756.6 | 1,258.5 | 993.2 | 1,881.5 | 1,877.4 | 1,873.4 | 1,869.4 | 1,865.4 |
| Depreciation | ||||||||||
| Changes in Account Receivables | ||||||||||
| Changes in Inventories | ||||||||||
| Changes in Accounts Payable | ||||||||||
| Capital Expenditure | ||||||||||
| UFCF | -7,537.0 | -1,817.2 | 7,182.4 | 2,577.7 | -1,234.0 | -2,662.7 | 1,915.0 | 1,910.9 | 1,906.8 | 1,902.7 |
| WACC, % | 7.28 | 6.82 | 6.1 | 6.38 | 6.52 | 6.62 | 6.62 | 6.62 | 6.62 | 6.62 |
| PV UFCF | ||||||||||
| SUM PV UFCF | 3,620.5 | |||||||||
| Long Term Growth Rate, % | 2.00 | |||||||||
| Free cash flow (T + 1) | 1,941 | |||||||||
| Terminal Value | 42,020 | |||||||||
| Present Terminal Value | 30,499 | |||||||||
| Enterprise Value | 34,120 | |||||||||
| Net Debt | -3,804 | |||||||||
| Equity Value | 37,924 | |||||||||
| Diluted Shares Outstanding, MM | 2,523 | |||||||||
| Equity Value Per Share | 15.03 |
What You Will Receive
- Adjustable Forecast Inputs: Effortlessly modify key assumptions (growth %, margins, WACC) to explore various scenarios.
- Real-World Data: TCL Electronics Holdings Limited's (1070HK) financial information pre-loaded to kickstart your analysis.
- Automatic DCF Outputs: The template seamlessly computes Net Present Value (NPV) and intrinsic value for your convenience.
- Customizable and Professional: A sophisticated Excel model tailored to meet your valuation requirements.
- Designed for Analysts and Investors: Perfect for testing projections, validating strategies, and optimizing efficiency.
Key Features
- Pre-Loaded Data: TCL Electronics' historical financial statements and pre-filled forecasts.
- Fully Adjustable Inputs: Customize WACC, tax rates, revenue growth, and EBITDA margins as needed.
- Instant Results: View TCL's intrinsic value recalculating in real time.
- Clear Visual Outputs: Dashboard charts present valuation outcomes and critical metrics.
- Built for Accuracy: A professional-grade tool designed for analysts, investors, and finance professionals.
How It Works
- Step 1: Download the Excel file.
- Step 2: Review TCL Electronics Holdings Limited's (1070HK) pre-filled financial data and forecasts.
- Step 3: Adjust key inputs such as revenue growth, WACC, and tax rates (highlighted cells).
- Step 4: Observe the DCF model update in real-time as you modify your assumptions.
- Step 5: Evaluate the results and utilize the findings for your investment decisions.
Why Opt for This Calculator?
- Reliable Data: Access accurate financial information for TCL Electronics Holdings Limited (1070HK) to ensure trustworthy valuation outcomes.
- Fully Customizable: Tailor essential parameters such as growth rates, WACC, and tax rates to align with your forecasts.
- Efficient: Pre-configured calculations save you the hassle of starting from the ground up.
- Professional Quality: Crafted for investors, analysts, and consultants in the field.
- Easy to Use: With a user-friendly design and clear step-by-step guidelines, it’s accessible for everyone.
Who Can Benefit from TCL Electronics Holdings Limited (1070HK)?
- Investors: Gain insights and make informed choices with our advanced valuation tools.
- Financial Analysts: Streamline your processes with a customizable DCF model designed for efficiency.
- Consultants: Effortlessly modify the template for impactful client presentations or comprehensive reports.
- Finance Enthusiasts: Enhance your knowledge of valuation methods through practical, real-world examples.
- Educators and Students: Utilize this resource as a hands-on learning aid in finance-related curricula.
Contents of the Template
- Pre-Filled DCF Model: TCL Electronics’ financial information preloaded for immediate application.
- WACC Calculator: Comprehensive calculations for the Weighted Average Cost of Capital.
- Financial Ratios: Assess TCL’s profitability, leverage, and operational efficiency.
- Editable Inputs: Modify assumptions like growth rates, profit margins, and capital expenditures to align with your scenarios.
- Financial Statements: Access annual and quarterly reports to facilitate in-depth analysis.
- Interactive Dashboard: Effortlessly visualize essential valuation metrics and outcomes.
Disclaimer
All information, articles, and product details provided on this website are for general informational and educational purposes only. We do not claim any ownership over, nor do we intend to infringe upon, any trademarks, copyrights, logos, brand names, or other intellectual property mentioned or depicted on this site. Such intellectual property remains the property of its respective owners, and any references here are made solely for identification or informational purposes, without implying any affiliation, endorsement, or partnership.
We make no representations or warranties, express or implied, regarding the accuracy, completeness, or suitability of any content or products presented. Nothing on this website should be construed as legal, tax, investment, financial, medical, or other professional advice. In addition, no part of this site—including articles or product references—constitutes a solicitation, recommendation, endorsement, advertisement, or offer to buy or sell any securities, franchises, or other financial instruments, particularly in jurisdictions where such activity would be unlawful.
All content is of a general nature and may not address the specific circumstances of any individual or entity. It is not a substitute for professional advice or services. Any actions you take based on the information provided here are strictly at your own risk. You accept full responsibility for any decisions or outcomes arising from your use of this website and agree to release us from any liability in connection with your use of, or reliance upon, the content or products found herein.