
|
LifeTech Scientific Corporation (1302.HK) DCF Valuation |
Fully Editable: Tailor To Your Needs In Excel Or Sheets
Professional Design: Trusted, Industry-Standard Templates
Investor-Approved Valuation Models
MAC/PC Compatible, Fully Unlocked
No Expertise Is Needed; Easy To Follow
LifeTech Scientific Corporation (1302.HK) Bundle
Streamline your analysis and improve precision with our (1302HK) DCF Calculator! Utilizing actual data from LifeTech Scientific Corporation and customizable assumptions, this tool empowers you to forecast, analyze, and evaluate (1302HK) like a seasoned investor.
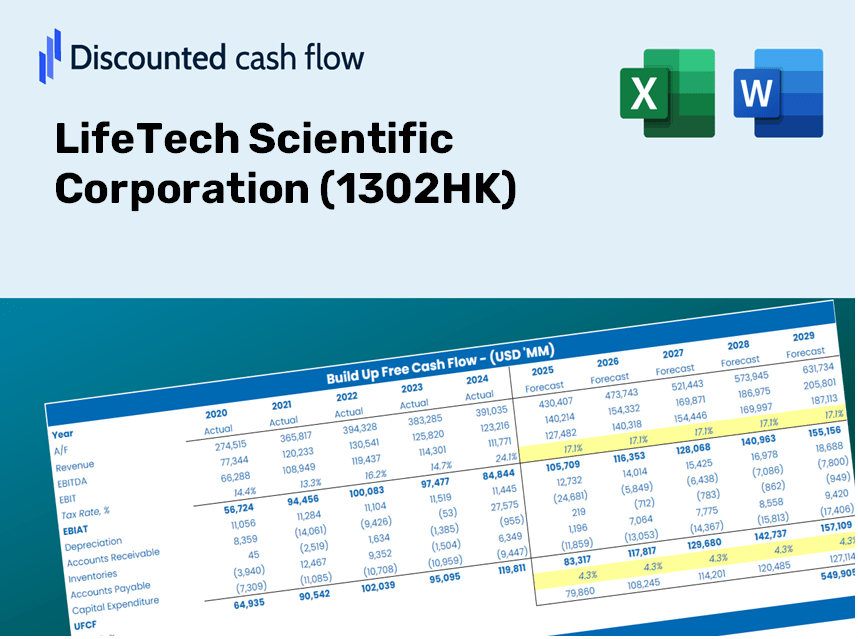
Discounted Cash Flow (DCF) - (USD MM)
| Year | AY1 2020 |
AY2 2021 |
AY3 2022 |
AY4 2023 |
AY5 2024 |
FY1 2025 |
FY2 2026 |
FY3 2027 |
FY4 2028 |
FY5 2029 |
|---|---|---|---|---|---|---|---|---|---|---|
| Revenue | 702.3 | 1,011.8 | 1,199.8 | 1,385.5 | 1,425.5 | 1,714.2 | 2,061.3 | 2,478.8 | 2,980.9 | 3,584.6 |
| Revenue Growth, % | 0 | 44.07 | 18.59 | 15.48 | 2.88 | 20.25 | 20.25 | 20.25 | 20.25 | 20.25 |
| EBITDA | 343.5 | 434.7 | 487.4 | 277.1 | 297.3 | 594.3 | 714.7 | 859.4 | 1,033.5 | 1,242.8 |
| EBITDA, % | 48.91 | 42.97 | 40.63 | 20 | 20.85 | 34.67 | 34.67 | 34.67 | 34.67 | 34.67 |
| Depreciation | 50.1 | 67.8 | 73.4 | 84.4 | 69.4 | 106.0 | 127.5 | 153.3 | 184.3 | 221.6 |
| Depreciation, % | 7.13 | 6.71 | 6.12 | 6.09 | 4.87 | 6.18 | 6.18 | 6.18 | 6.18 | 6.18 |
| EBIT | 293.4 | 366.9 | 414.0 | 192.8 | 227.8 | 488.3 | 587.2 | 706.2 | 849.2 | 1,021.2 |
| EBIT, % | 41.77 | 36.26 | 34.51 | 13.91 | 15.98 | 28.49 | 28.49 | 28.49 | 28.49 | 28.49 |
| Total Cash | 1,249.4 | 1,614.3 | 911.7 | 1,289.5 | 1,292.3 | 1,576.0 | 1,895.2 | 2,279.1 | 2,740.7 | 3,295.8 |
| Total Cash, percent | .0 | .0 | .0 | .0 | .0 | .0 | .0 | .0 | .0 | .0 |
| Account Receivables | 117.1 | 120.3 | 149.9 | 115.0 | 170.0 | 210.1 | 252.7 | 303.9 | 365.4 | 439.4 |
| Account Receivables, % | 16.68 | 11.89 | 12.49 | 8.3 | 11.93 | 12.26 | 12.26 | 12.26 | 12.26 | 12.26 |
| Inventories | 108.9 | 141.4 | 264.0 | 528.8 | 582.1 | 447.3 | 537.9 | 646.9 | 777.9 | 935.5 |
| Inventories, % | 15.51 | 13.97 | 22 | 38.16 | 40.84 | 26.1 | 26.1 | 26.1 | 26.1 | 26.1 |
| Accounts Payable | 20.5 | 33.6 | 68.5 | 135.7 | 65.1 | 90.2 | 108.5 | 130.4 | 156.8 | 188.6 |
| Accounts Payable, % | 2.91 | 3.32 | 5.71 | 9.79 | 4.57 | 5.26 | 5.26 | 5.26 | 5.26 | 5.26 |
| Capital Expenditure | -173.2 | -375.3 | -366.8 | -320.0 | -309.4 | -470.1 | -565.4 | -679.9 | -817.6 | -983.1 |
| Capital Expenditure, % | -24.66 | -37.1 | -30.57 | -23.1 | -21.71 | -27.43 | -27.43 | -27.43 | -27.43 | -27.43 |
| Tax Rate, % | -11.76 | -11.76 | -11.76 | -11.76 | -11.76 | -11.76 | -11.76 | -11.76 | -11.76 | -11.76 |
| EBITAT | 261.3 | 322.3 | 356.3 | 289.0 | 254.6 | 452.2 | 543.7 | 653.9 | 786.3 | 945.6 |
| Depreciation | ||||||||||
| Changes in Account Receivables | ||||||||||
| Changes in Inventories | ||||||||||
| Changes in Accounts Payable | ||||||||||
| Capital Expenditure | ||||||||||
| UFCF | -67.4 | -7.6 | -54.4 | -109.4 | -164.3 | 207.8 | -9.1 | -10.9 | -13.1 | -15.7 |
| WACC, % | 5.73 | 5.73 | 5.73 | 5.73 | 5.73 | 5.73 | 5.73 | 5.73 | 5.73 | 5.73 |
| PV UFCF | ||||||||||
| SUM PV UFCF | 156.8 | |||||||||
| Long Term Growth Rate, % | 3.50 | |||||||||
| Free cash flow (T + 1) | -16 | |||||||||
| Terminal Value | -732 | |||||||||
| Present Terminal Value | -554 | |||||||||
| Enterprise Value | -397 | |||||||||
| Net Debt | -722 | |||||||||
| Equity Value | 326 | |||||||||
| Diluted Shares Outstanding, MM | 4,394 | |||||||||
| Equity Value Per Share | 0.07 |
What You Will Receive
- Comprehensive Financial Model: Utilize LifeTech’s real data for an accurate DCF valuation.
- Complete Forecast Flexibility: Modify revenue growth, profit margins, WACC, and other essential factors.
- Real-Time Calculations: Immediate updates allow you to see results as you implement changes.
- Professional-Grade Template: A polished Excel file crafted for high-quality valuation.
- Customizable and Reusable: Designed for versatility, enabling repeated use for in-depth forecasts.
Key Features
- 🔍 Real-Life LifeTech Financials: Pre-filled historical and projected data for LifeTech Scientific Corporation (1302HK).
- ✏️ Fully Customizable Inputs: Adjust all critical parameters (yellow cells) such as WACC, growth %, and tax rates.
- 📊 Professional DCF Valuation: Integrated formulas calculate LifeTech’s intrinsic value using the Discounted Cash Flow method.
- ⚡ Instant Results: Visualize LifeTech’s valuation immediately after making adjustments.
- Scenario Analysis: Evaluate and compare outcomes for different financial assumptions side-by-side.
How It Works
- Download: Obtain the pre-configured Excel file featuring LifeTech Scientific Corporation's (1302HK) financial data.
- Customize: Modify forecasts, such as revenue growth, EBITDA %, and WACC to suit your analysis.
- Update Automatically: The calculations for intrinsic value and NPV refresh in real-time.
- Test Scenarios: Generate various projections and instantly compare their outcomes.
- Make Decisions: Leverage the valuation results to inform your investment choices.
Why Choose LifeTech Scientific Corporation (1302HK) Calculator?
- Precision: Accurate financial data sourced directly from LifeTech Scientific Corporation (1302HK).
- Versatility: Tailored for users to experiment with and adjust inputs with ease.
- Efficiency: Eliminate the complexities of creating a financial model from the ground up.
- Industry-Standard: Crafted with the expertise and usability expected at the CFO level.
- Intuitive: Simple to navigate, even for those without extensive financial modeling skills.
Who Can Benefit from LifeTech Scientific Corporation (1302HK)?
- Investors: Empower your investment choices with a sophisticated valuation tool designed for accuracy.
- Financial Analysts: Enhance efficiency with a customizable DCF model tailored for your analysis.
- Consultants: Seamlessly adapt the template for impactful client presentations or comprehensive reports.
- Finance Enthusiasts: Expand your knowledge of valuation methodologies through practical, real-life examples.
- Educators and Students: Utilize this resource as an effective learning aid in finance-related academic programs.
What the Template Contains
- Operating and Balance Sheet Data: Pre-filled historical data and forecasts for LifeTech Scientific Corporation (1302HK), including revenue, EBITDA, EBIT, and capital expenditures.
- WACC Calculation: A dedicated sheet for Weighted Average Cost of Capital (WACC), encompassing parameters such as Beta, risk-free rate, and share price.
- DCF Valuation (Unlevered and Levered): Editable Discounted Cash Flow models illustrating intrinsic value with comprehensive calculations.
- Financial Statements: Pre-loaded financial statements (annual and quarterly) to facilitate analysis.
- Key Ratios: Features profitability, leverage, and efficiency ratios specific to LifeTech Scientific Corporation (1302HK).
- Dashboard and Charts: Visual summary of valuation outputs and assumptions for straightforward result analysis.
Disclaimer
All information, articles, and product details provided on this website are for general informational and educational purposes only. We do not claim any ownership over, nor do we intend to infringe upon, any trademarks, copyrights, logos, brand names, or other intellectual property mentioned or depicted on this site. Such intellectual property remains the property of its respective owners, and any references here are made solely for identification or informational purposes, without implying any affiliation, endorsement, or partnership.
We make no representations or warranties, express or implied, regarding the accuracy, completeness, or suitability of any content or products presented. Nothing on this website should be construed as legal, tax, investment, financial, medical, or other professional advice. In addition, no part of this site—including articles or product references—constitutes a solicitation, recommendation, endorsement, advertisement, or offer to buy or sell any securities, franchises, or other financial instruments, particularly in jurisdictions where such activity would be unlawful.
All content is of a general nature and may not address the specific circumstances of any individual or entity. It is not a substitute for professional advice or services. Any actions you take based on the information provided here are strictly at your own risk. You accept full responsibility for any decisions or outcomes arising from your use of this website and agree to release us from any liability in connection with your use of, or reliance upon, the content or products found herein.