
|
HKBN Ltd. (1310.HK) DCF Valuation |
Fully Editable: Tailor To Your Needs In Excel Or Sheets
Professional Design: Trusted, Industry-Standard Templates
Investor-Approved Valuation Models
MAC/PC Compatible, Fully Unlocked
No Expertise Is Needed; Easy To Follow
HKBN Ltd. (1310.HK) Bundle
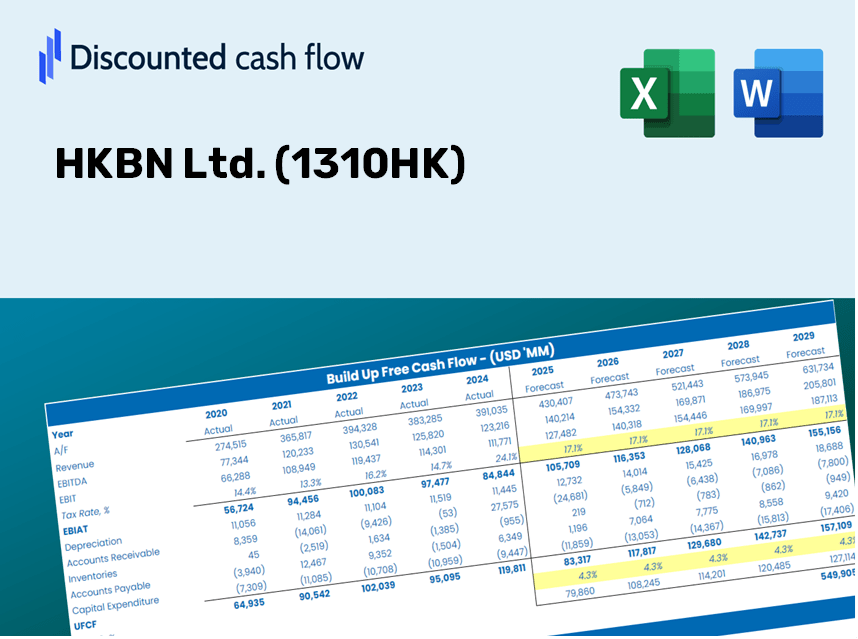
Gain insights into your HKBN Ltd. (1310HK) valuation analysis with our sophisticated DCF Calculator! This Excel template comes preloaded with real data for (1310HK), enabling you to adjust forecasts and assumptions to accurately determine the intrinsic value of HKBN Ltd.
Discounted Cash Flow (DCF) - (USD MM)
| Year | AY1 2020 |
AY2 2021 |
AY3 2022 |
AY4 2023 |
AY5 2024 |
FY1 2025 |
FY2 2026 |
FY3 2027 |
FY4 2028 |
FY5 2029 |
|---|---|---|---|---|---|---|---|---|---|---|
| Revenue | 9,453.0 | 11,463.7 | 11,626.2 | 11,692.2 | 10,650.9 | 11,033.0 | 11,428.9 | 11,838.9 | 12,263.6 | 12,703.6 |
| Revenue Growth, % | 0 | 21.27 | 1.42 | 0.56779 | -8.91 | 3.59 | 3.59 | 3.59 | 3.59 | 3.59 |
| EBITDA | 2,598.4 | 2,585.2 | 2,833.9 | 1,211.3 | 2,137.5 | 2,313.4 | 2,396.4 | 2,482.4 | 2,571.5 | 2,663.7 |
| EBITDA, % | 27.49 | 22.55 | 24.38 | 10.36 | 20.07 | 20.97 | 20.97 | 20.97 | 20.97 | 20.97 |
| Depreciation | 1,982.5 | 1,864.2 | 1,703.3 | 1,602.6 | 1,249.2 | 1,706.1 | 1,767.3 | 1,830.7 | 1,896.4 | 1,964.4 |
| Depreciation, % | 20.97 | 16.26 | 14.65 | 13.71 | 11.73 | 15.46 | 15.46 | 15.46 | 15.46 | 15.46 |
| EBIT | 615.9 | 721.0 | 1,130.7 | -391.3 | 888.3 | 607.3 | 629.1 | 651.7 | 675.1 | 699.3 |
| EBIT, % | 6.52 | 6.29 | 9.73 | -3.35 | 8.34 | 5.5 | 5.5 | 5.5 | 5.5 | 5.5 |
| Total Cash | 717.0 | 1,421.1 | 1,205.6 | 1,030.5 | 1,217.4 | 1,116.4 | 1,156.5 | 1,198.0 | 1,241.0 | 1,285.5 |
| Total Cash, percent | .0 | .0 | .0 | .0 | .0 | .0 | .0 | .0 | .0 | .0 |
| Account Receivables | 1,682.3 | 1,330.9 | 1,262.3 | 1,230.5 | 1,224.6 | 1,374.4 | 1,423.7 | 1,474.8 | 1,527.7 | 1,582.5 |
| Account Receivables, % | 17.8 | 11.61 | 10.86 | 10.52 | 11.5 | 12.46 | 12.46 | 12.46 | 12.46 | 12.46 |
| Inventories | 154.6 | 110.6 | 111.5 | 105.7 | 106.2 | 120.5 | 124.8 | 129.3 | 133.9 | 138.7 |
| Inventories, % | 1.64 | 0.96491 | 0.95885 | 0.90386 | 0.99707 | 1.09 | 1.09 | 1.09 | 1.09 | 1.09 |
| Accounts Payable | 830.8 | 935.9 | 778.7 | 927.7 | 945.9 | 892.9 | 924.9 | 958.1 | 992.5 | 1,028.1 |
| Accounts Payable, % | 8.79 | 8.16 | 6.7 | 7.93 | 8.88 | 8.09 | 8.09 | 8.09 | 8.09 | 8.09 |
| Capital Expenditure | -541.4 | -572.4 | -516.1 | -489.4 | -362.9 | -502.1 | -520.1 | -538.7 | -558.0 | -578.1 |
| Capital Expenditure, % | -5.73 | -4.99 | -4.44 | -4.19 | -3.41 | -4.55 | -4.55 | -4.55 | -4.55 | -4.55 |
| Tax Rate, % | 64.71 | 64.71 | 64.71 | 64.71 | 64.71 | 64.71 | 64.71 | 64.71 | 64.71 | 64.71 |
| EBITAT | 648.1 | 458.6 | 878.4 | -402.8 | 313.4 | 457.4 | 473.8 | 490.8 | 508.4 | 526.7 |
| Depreciation | ||||||||||
| Changes in Account Receivables | ||||||||||
| Changes in Inventories | ||||||||||
| Changes in Accounts Payable | ||||||||||
| Capital Expenditure | ||||||||||
| UFCF | 1,083.0 | 2,250.9 | 1,976.1 | 897.0 | 1,223.4 | 1,444.4 | 1,699.5 | 1,760.5 | 1,823.6 | 1,889.0 |
| WACC, % | 7.13 | 5.62 | 6.21 | 7.13 | 4.45 | 6.11 | 6.11 | 6.11 | 6.11 | 6.11 |
| PV UFCF | ||||||||||
| SUM PV UFCF | 7,187.4 | |||||||||
| Long Term Growth Rate, % | 3.00 | |||||||||
| Free cash flow (T + 1) | 1,946 | |||||||||
| Terminal Value | 62,614 | |||||||||
| Present Terminal Value | 46,552 | |||||||||
| Enterprise Value | 53,740 | |||||||||
| Net Debt | 10,254 | |||||||||
| Equity Value | 43,485 | |||||||||
| Diluted Shares Outstanding, MM | 1,478 | |||||||||
| Equity Value Per Share | 29.42 |
What You Will Receive
- Authentic HKBN Data: Comprehensive financial information – covering everything from revenue to EBIT – based on real and projected figures.
- Complete Customization: Modify all essential variables (yellow cells) including WACC, growth %, and tax rates.
- Instant Valuation Adjustments: Automatic recalculations to assess the effects of changes on HKBN's fair value.
- Flexible Excel Template: Designed for quick modifications, scenario analysis, and thorough projections.
- Efficient and Precise: Avoid starting from scratch while ensuring accuracy and adaptability.
Key Features
- Pre-Loaded Data: HKBN Ltd.'s historical financial statements and pre-filled forecasts.
- Fully Adjustable Inputs: Modify WACC, tax rates, revenue growth, and EBITDA margins as needed.
- Instant Results: View HKBN Ltd.'s intrinsic value recalculating in real time.
- Clear Visual Outputs: Dashboard charts illustrate valuation results and essential metrics.
- Built for Accuracy: A professional-grade tool designed for analysts, investors, and finance specialists.
How It Works
- Step 1: Download the Excel file.
- Step 2: Review the pre-filled HKBN Ltd. (1310HK) data (historical and projected).
- Step 3: Modify key assumptions (yellow cells) according to your analysis.
- Step 4: Observe the automatic recalculations for HKBN Ltd.'s (1310HK) intrinsic value.
- Step 5: Utilize the results for investment decisions or reporting.
Why Opt for HKBN Ltd. (1310HK) Calculator?
- Efficient Use of Time: Jump straight into calculations without the hassle of building a DCF model from the ground up.
- Enhanced Accuracy: Dependable financial data and precise formulas minimize valuation errors.
- Completely Customizable: Adjust the model to accurately reflect your unique assumptions and forecasts.
- User-Friendly Interpretation: Intuitive charts and outputs simplify data analysis.
- Trusted by Industry Professionals: Crafted for those who prioritize accuracy and ease of use.
Who Can Benefit from This Product?
- Professional Investors: Develop comprehensive and trustworthy valuation models for portfolio assessment of HKBN Ltd. (1310HK).
- Corporate Finance Teams: Evaluate valuation scenarios to inform strategic decisions within the organization.
- Consultants and Advisors: Deliver precise valuation insights to clients regarding HKBN Ltd. (1310HK).
- Students and Educators: Utilize real-world data to enhance learning and practice in financial modeling.
- Tech Enthusiasts: Gain insights into the market valuation of telecommunications companies like HKBN Ltd. (1310HK).
Contents of the Template
- Pre-Filled DCF Model: HKBN Ltd.’s financial data preloaded for immediate application.
- WACC Calculator: Comprehensive calculations for the Weighted Average Cost of Capital.
- Financial Ratios: Assess HKBN Ltd.’s profitability, leverage, and operational efficiency.
- Editable Inputs: Modify assumptions such as growth rates, margins, and capital expenditures to suit your scenarios.
- Financial Statements: Annual and quarterly reports available for in-depth analysis.
- Interactive Dashboard: Effortlessly visualize important valuation metrics and outcomes.
Disclaimer
All information, articles, and product details provided on this website are for general informational and educational purposes only. We do not claim any ownership over, nor do we intend to infringe upon, any trademarks, copyrights, logos, brand names, or other intellectual property mentioned or depicted on this site. Such intellectual property remains the property of its respective owners, and any references here are made solely for identification or informational purposes, without implying any affiliation, endorsement, or partnership.
We make no representations or warranties, express or implied, regarding the accuracy, completeness, or suitability of any content or products presented. Nothing on this website should be construed as legal, tax, investment, financial, medical, or other professional advice. In addition, no part of this site—including articles or product references—constitutes a solicitation, recommendation, endorsement, advertisement, or offer to buy or sell any securities, franchises, or other financial instruments, particularly in jurisdictions where such activity would be unlawful.
All content is of a general nature and may not address the specific circumstances of any individual or entity. It is not a substitute for professional advice or services. Any actions you take based on the information provided here are strictly at your own risk. You accept full responsibility for any decisions or outcomes arising from your use of this website and agree to release us from any liability in connection with your use of, or reliance upon, the content or products found herein.