
|
Shanghai Fudan Microelectronics Group Company Limited (1385.HK) DCF Valuation |
Fully Editable: Tailor To Your Needs In Excel Or Sheets
Professional Design: Trusted, Industry-Standard Templates
Investor-Approved Valuation Models
MAC/PC Compatible, Fully Unlocked
No Expertise Is Needed; Easy To Follow
Shanghai Fudan Microelectronics Group Company Limited (1385.HK) Bundle
Enhance your investment strategies with the (1385HK) DCF Calculator! Utilize real financial data from Shanghai Fudan Microelectronics Group Company Limited, adjust growth projections and expenses, and observe how these modifications affect the intrinsic value of (1385HK) in real-time.
Discounted Cash Flow (DCF) - (USD MM)
| Year | AY1 2020 |
AY2 2021 |
AY3 2022 |
AY4 2023 |
AY5 2024 |
FY1 2025 |
FY2 2026 |
FY3 2027 |
FY4 2028 |
FY5 2029 |
|---|---|---|---|---|---|---|---|---|---|---|
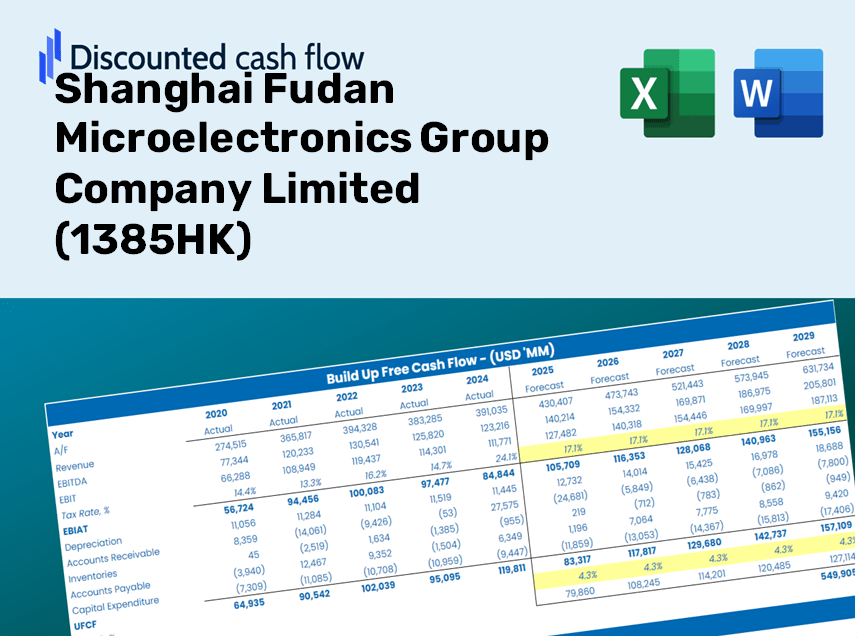
| Revenue | 1,849.4 | 2,818.8 | 3,870.6 | 3,867.7 | 3,926.7 | 4,821.9 | 5,921.1 | 7,270.8 | 8,928.3 | 10,963.6 |
| Revenue Growth, % | 0 | 52.42 | 37.31 | -0.07486664 | 1.53 | 22.8 | 22.8 | 22.8 | 22.8 | 22.8 |
| EBITDA | 367.6 | 865.3 | 1,426.8 | 1,118.9 | 713.7 | 1,297.5 | 1,593.2 | 1,956.4 | 2,402.4 | 2,950.1 |
| EBITDA, % | 19.88 | 30.7 | 36.86 | 28.93 | 18.17 | 26.91 | 26.91 | 26.91 | 26.91 | 26.91 |
| Depreciation | 179.5 | 233.2 | 195.4 | 266.0 | 208.4 | 339.5 | 416.9 | 512.0 | 628.7 | 772.0 |
| Depreciation, % | 9.7 | 8.27 | 5.05 | 6.88 | 5.31 | 7.04 | 7.04 | 7.04 | 7.04 | 7.04 |
| EBIT | 188.1 | 632.2 | 1,231.4 | 852.9 | 505.3 | 957.9 | 1,176.3 | 1,444.5 | 1,773.7 | 2,178.1 |
| EBIT, % | 10.17 | 22.43 | 31.81 | 22.05 | 12.87 | 19.87 | 19.87 | 19.87 | 19.87 | 19.87 |
| Total Cash | 482.0 | 1,304.4 | 1,390.1 | 1,130.4 | 1,343.0 | 1,655.6 | 2,033.1 | 2,496.5 | 3,065.6 | 3,764.5 |
| Total Cash, percent | .0 | .0 | .0 | .0 | .0 | .0 | .0 | .0 | .0 | .0 |
| Account Receivables | 805.2 | 901.3 | 1,163.8 | 1,615.7 | 2,124.3 | 1,942.8 | 2,385.6 | 2,929.4 | 3,597.2 | 4,417.3 |
| Account Receivables, % | 43.54 | 31.97 | 30.07 | 41.77 | 54.1 | 40.29 | 40.29 | 40.29 | 40.29 | 40.29 |
| Inventories | 667.8 | 1,002.0 | 1,622.3 | 3,475.2 | 3,428.3 | 2,803.7 | 3,442.8 | 4,227.6 | 5,191.4 | 6,374.8 |
| Inventories, % | 36.11 | 35.54 | 41.91 | 89.85 | 87.31 | 58.15 | 58.15 | 58.15 | 58.15 | 58.15 |
| Accounts Payable | 174.6 | 219.0 | 220.0 | 257.9 | 256.6 | 348.1 | 427.4 | 524.9 | 644.5 | 791.5 |
| Accounts Payable, % | 9.44 | 7.77 | 5.68 | 6.67 | 6.54 | 7.22 | 7.22 | 7.22 | 7.22 | 7.22 |
| Capital Expenditure | -260.0 | -617.4 | -855.9 | -930.7 | -692.3 | -962.1 | -1,181.5 | -1,450.8 | -1,781.5 | -2,187.6 |
| Capital Expenditure, % | -14.06 | -21.9 | -22.11 | -24.06 | -17.63 | -19.95 | -19.95 | -19.95 | -19.95 | -19.95 |
| Tax Rate, % | -2.45 | -2.45 | -2.45 | -2.45 | -2.45 | -2.45 | -2.45 | -2.45 | -2.45 | -2.45 |
| EBITAT | 146.3 | 567.1 | 1,182.4 | 816.2 | 517.7 | 879.8 | 1,080.3 | 1,326.6 | 1,629.0 | 2,000.3 |
| Depreciation | ||||||||||
| Changes in Account Receivables | ||||||||||
| Changes in Inventories | ||||||||||
| Changes in Accounts Payable | ||||||||||
| Capital Expenditure | ||||||||||
| UFCF | -1,232.8 | -202.9 | -360.0 | -2,115.4 | -429.1 | 1,154.7 | -686.9 | -843.5 | -1,035.7 | -1,271.8 |
| WACC, % | 4.44 | 4.46 | 4.48 | 4.47 | 4.48 | 4.47 | 4.47 | 4.47 | 4.47 | 4.47 |
| PV UFCF | ||||||||||
| SUM PV UFCF | -2,155.6 | |||||||||
| Long Term Growth Rate, % | 4.00 | |||||||||
| Free cash flow (T + 1) | -1,323 | |||||||||
| Terminal Value | -283,009 | |||||||||
| Present Terminal Value | -227,456 | |||||||||
| Enterprise Value | -229,611 | |||||||||
| Net Debt | 657 | |||||||||
| Equity Value | -230,269 | |||||||||
| Diluted Shares Outstanding, MM | 818 | |||||||||
| Equity Value Per Share | -281.50 |
What You Will Receive
- Authentic 1385HK Financial Data: Pre-loaded with Shanghai Fudan Microelectronics' historical and projected data for accurate analysis.
- Fully Customizable Template: Effortlessly adjust key inputs such as revenue growth, WACC, and EBITDA percentage.
- Instant Calculations: Watch the intrinsic value of 1385HK update in real-time as you make adjustments.
- Professional Valuation Tool: Created for investors, analysts, and consultants aiming for precise DCF outcomes.
- User-Friendly Interface: Intuitive layout and straightforward instructions suitable for all skill levels.
Key Features
- Authentic 1385HK Data: Pre-loaded with Shanghai Fudan Microelectronics Group's historical performance and outlook projections.
- Completely Customizable Inputs: Modify revenue growth rates, profit margins, WACC, tax rates, and capital expenditures as needed.
- Interactive Valuation Model: Automatic adjustments to Net Present Value (NPV) and intrinsic value based on your tailored inputs.
- Scenario Analysis: Develop multiple forecasting scenarios to explore various valuation possibilities.
- Intuitive Interface: Designed for ease of use, catering to both professionals and newcomers.
Understanding the Process
- Step 1: Download the ready-to-use Excel template that includes data for Shanghai Fudan Microelectronics Group Company Limited (1385HK).
- Step 2: Review the pre-populated sheets to familiarize yourself with the important metrics.
- Step 3: Adjust the forecasts and assumptions in the editable yellow cells (such as WACC, growth rates, and profit margins).
- Step 4: Instantly see the updated results, including the intrinsic value of Shanghai Fudan Microelectronics Group Company Limited (1385HK).
- Step 5: Use the outputs to make well-informed investment choices or to create detailed reports.
Why Opt for This Calculator?
- User-Friendly Interface: Tailored for both novice and experienced users.
- Customizable Parameters: Adjust inputs seamlessly to suit your analysis needs.
- Real-Time Feedback: Observe immediate updates to the valuation of Shanghai Fudan Microelectronics Group Company Limited (1385HK) as you modify entries.
- Pre-Configured: Comes with the latest financial data for Shanghai Fudan Microelectronics for swift assessments.
- Relied Upon by Experts: Favored by investors and analysts for making strategic decisions.
Who Should Utilize This Product?
- Individual Investors: Make informed choices about buying or selling shares of Shanghai Fudan Microelectronics Group Company Limited (1385HK).
- Financial Analysts: Enhance valuation processes with pre-built financial models tailored for (1385HK).
- Consultants: Provide clients with accurate and professional valuation insights swiftly for (1385HK).
- Business Owners: Gain insights into how major firms like Shanghai Fudan Microelectronics (1385HK) are valued to inform your strategic decisions.
- Finance Students: Master valuation techniques by engaging with real-world data and case studies related to (1385HK).
Contents of the Template
- Operating and Balance Sheet Data: Pre-filled historical data and forecasts for Shanghai Fudan Microelectronics Group Company Limited (1385HK), including revenue, EBITDA, EBIT, and capital expenditures.
- WACC Calculation: A dedicated sheet for Weighted Average Cost of Capital (WACC), featuring parameters such as Beta, risk-free rate, and share price.
- DCF Valuation (Unlevered and Levered): Editable Discounted Cash Flow models that provide intrinsic value calculations in detail.
- Financial Statements: Pre-loaded financial statements (annual and quarterly) to enhance analysis.
- Key Ratios: Includes profitability, leverage, and efficiency ratios pertinent to Shanghai Fudan Microelectronics Group Company Limited (1385HK).
- Dashboard and Charts: A visual summary of valuation outputs and assumptions to facilitate easy result analysis.
Disclaimer
All information, articles, and product details provided on this website are for general informational and educational purposes only. We do not claim any ownership over, nor do we intend to infringe upon, any trademarks, copyrights, logos, brand names, or other intellectual property mentioned or depicted on this site. Such intellectual property remains the property of its respective owners, and any references here are made solely for identification or informational purposes, without implying any affiliation, endorsement, or partnership.
We make no representations or warranties, express or implied, regarding the accuracy, completeness, or suitability of any content or products presented. Nothing on this website should be construed as legal, tax, investment, financial, medical, or other professional advice. In addition, no part of this site—including articles or product references—constitutes a solicitation, recommendation, endorsement, advertisement, or offer to buy or sell any securities, franchises, or other financial instruments, particularly in jurisdictions where such activity would be unlawful.
All content is of a general nature and may not address the specific circumstances of any individual or entity. It is not a substitute for professional advice or services. Any actions you take based on the information provided here are strictly at your own risk. You accept full responsibility for any decisions or outcomes arising from your use of this website and agree to release us from any liability in connection with your use of, or reliance upon, the content or products found herein.