
|
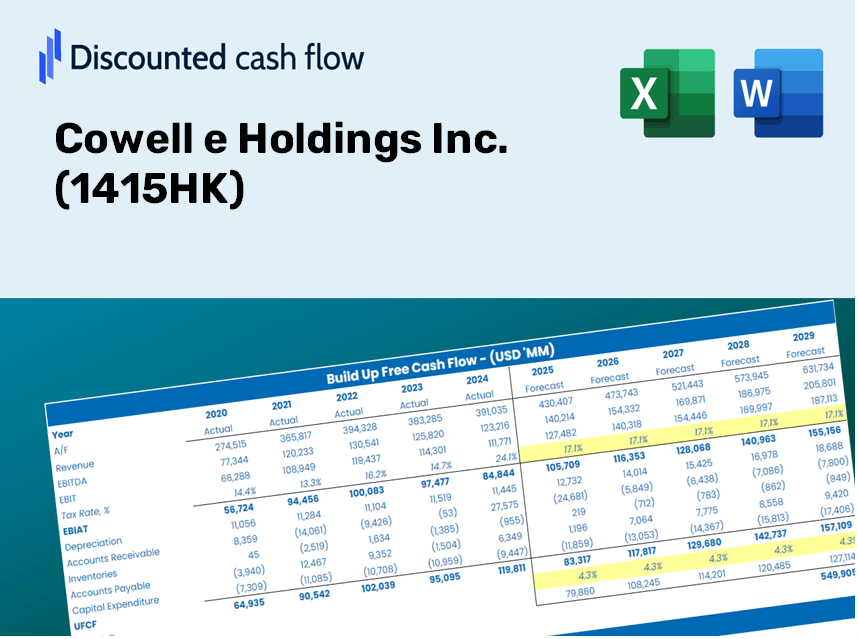
Cowell e Holdings Inc. (1415.HK) DCF Valuation |
Fully Editable: Tailor To Your Needs In Excel Or Sheets
Professional Design: Trusted, Industry-Standard Templates
Investor-Approved Valuation Models
MAC/PC Compatible, Fully Unlocked
No Expertise Is Needed; Easy To Follow
Cowell e Holdings Inc. (1415.HK) Bundle
Simplify Cowell e Holdings Inc. (1415HK) valuation with this customizable DCF Calculator! Featuring real Cowell e Holdings Inc. (1415HK) financials and adjustable forecast inputs, you can test scenarios and uncover Cowell e Holdings Inc. (1415HK) fair value in minutes.
Discounted Cash Flow (DCF) - (USD MM)
| Year | AY1 2020 |
AY2 2021 |
AY3 2022 |
AY4 2023 |
AY5 2024 |
FY1 2025 |
FY2 2026 |
FY3 2027 |
FY4 2028 |
FY5 2029 |
|---|---|---|---|---|---|---|---|---|---|---|
| Revenue | 5,839.5 | 6,221.6 | 8,688.5 | 7,191.1 | 19,415.1 | 25,674.5 | 33,952.0 | 44,898.0 | 59,373.1 | 78,514.9 |
| Revenue Growth, % | 0 | 6.54 | 39.65 | -17.23 | 169.99 | 32.24 | 32.24 | 32.24 | 32.24 | 32.24 |
| EBITDA | 777.6 | 768.7 | 940.6 | 703.8 | 1,579.1 | 2,794.3 | 3,695.2 | 4,886.6 | 6,462.0 | 8,545.4 |
| EBITDA, % | 13.32 | 12.36 | 10.83 | 9.79 | 8.13 | 10.88 | 10.88 | 10.88 | 10.88 | 10.88 |
| Depreciation | 184.2 | 158.8 | 146.8 | 239.3 | 361.6 | 646.3 | 854.7 | 1,130.3 | 1,494.7 | 1,976.6 |
| Depreciation, % | 3.15 | 2.55 | 1.69 | 3.33 | 1.86 | 2.52 | 2.52 | 2.52 | 2.52 | 2.52 |
| EBIT | 593.4 | 609.9 | 793.8 | 464.5 | 1,217.5 | 2,148.0 | 2,840.5 | 3,756.3 | 4,967.3 | 6,568.8 |
| EBIT, % | 10.16 | 9.8 | 9.14 | 6.46 | 6.27 | 8.37 | 8.37 | 8.37 | 8.37 | 8.37 |
| Total Cash | 695.8 | 1,562.9 | 1,140.0 | 2,819.0 | 2,138.4 | 5,154.0 | 6,815.7 | 9,013.0 | 11,918.8 | 15,761.5 |
| Total Cash, percent | .0 | .0 | .0 | .0 | .0 | .0 | .0 | .0 | .0 | .0 |
| Account Receivables | 791.5 | 844.8 | 1,414.1 | 1,189.5 | 3,383.7 | 3,973.3 | 5,254.3 | 6,948.2 | 9,188.3 | 12,150.6 |
| Account Receivables, % | 13.55 | 13.58 | 16.28 | 16.54 | 17.43 | 15.48 | 15.48 | 15.48 | 15.48 | 15.48 |
| Inventories | 667.6 | 1,079.6 | 1,076.8 | 1,042.2 | 2,453.4 | 3,507.6 | 4,638.4 | 6,133.9 | 8,111.4 | 10,726.5 |
| Inventories, % | 11.43 | 17.35 | 12.39 | 14.49 | 12.64 | 13.66 | 13.66 | 13.66 | 13.66 | 13.66 |
| Accounts Payable | 757.2 | 928.8 | 1,526.8 | 1,628.4 | 3,713.4 | 4,479.6 | 5,923.9 | 7,833.7 | 10,359.3 | 13,699.1 |
| Accounts Payable, % | 12.97 | 14.93 | 17.57 | 22.64 | 19.13 | 17.45 | 17.45 | 17.45 | 17.45 | 17.45 |
| Capital Expenditure | -151.1 | -195.1 | -715.7 | -628.8 | -1,934.2 | -1,677.5 | -2,218.3 | -2,933.5 | -3,879.2 | -5,129.9 |
| Capital Expenditure, % | -2.59 | -3.14 | -8.24 | -8.74 | -9.96 | -6.53 | -6.53 | -6.53 | -6.53 | -6.53 |
| Tax Rate, % | 13.54 | 13.54 | 13.54 | 13.54 | 13.54 | 13.54 | 13.54 | 13.54 | 13.54 | 13.54 |
| EBITAT | 478.0 | 526.3 | 663.7 | 431.9 | 1,052.6 | 1,846.7 | 2,442.1 | 3,229.4 | 4,270.6 | 5,647.5 |
| Depreciation | ||||||||||
| Changes in Account Receivables | ||||||||||
| Changes in Inventories | ||||||||||
| Changes in Accounts Payable | ||||||||||
| Capital Expenditure | ||||||||||
| UFCF | -190.9 | 196.4 | 126.2 | 403.2 | -2,040.4 | -61.9 | 110.9 | 146.7 | 194.0 | 256.5 |
| WACC, % | 6.42 | 6.45 | 6.44 | 6.48 | 6.45 | 6.45 | 6.45 | 6.45 | 6.45 | 6.45 |
| PV UFCF | ||||||||||
| SUM PV UFCF | 500.1 | |||||||||
| Long Term Growth Rate, % | 3.50 | |||||||||
| Free cash flow (T + 1) | 266 | |||||||||
| Terminal Value | 8,999 | |||||||||
| Present Terminal Value | 6,583 | |||||||||
| Enterprise Value | 7,083 | |||||||||
| Net Debt | 1,933 | |||||||||
| Equity Value | 5,150 | |||||||||
| Diluted Shares Outstanding, MM | 888 | |||||||||
| Equity Value Per Share | 5.80 |
Benefits of Choosing Cowell e Holdings Inc. (1415HK)
- Comprehensive Financial Data: Access historical and projected financial metrics for precise valuation.
- Customizable Inputs: Adjust parameters such as WACC, tax rates, revenue growth, and capital expenditures.
- Dynamic Calculations: Intrinsic value and NPV are automatically computed for you.
- Scenario Analysis: Explore various scenarios to assess Cowell e Holdings' future performance.
- User-Friendly Design: Designed for industry professionals while remaining easy to navigate for newcomers.
Key Features
- Pre-Loaded Data: Cowell e Holdings Inc.’s (1415HK) historical financial statements and pre-filled forecasts.
- Fully Adjustable Inputs: Customize WACC, tax rates, revenue growth, and EBITDA margins.
- Instant Results: Watch Cowell e Holdings Inc.’s (1415HK) intrinsic value recalculate in real time.
- Clear Visual Outputs: Dashboard charts showcase valuation results and key metrics.
- Built for Accuracy: A professional tool designed for analysts, investors, and finance professionals.
How It Operates
- 1. Access the Template: Download and open the Excel file containing Cowell e Holdings Inc.'s preloaded data.
- 2. Modify Assumptions: Update key parameters such as growth rates, WACC, and capital expenditures.
- 3. View Results Instantly: The DCF model automatically calculates intrinsic value and NPV in real time.
- 4. Explore Scenarios: Evaluate various forecasts to examine different valuation possibilities.
- 5. Present with Assurance: Deliver professional valuation insights to bolster your decision-making process.
Why Choose the Cowell e Holdings Inc. Calculator?
- Precision: Utilizes authentic Cowell e Holdings financial data for reliable results.
- Versatility: Built to allow users to experiment with and adjust variables effortlessly.
- Efficiency: Eliminate the need to construct a DCF model from the ground up.
- Expert-Level: Crafted with the accuracy and functionality expected by financial leaders.
- Intuitive: User-friendly interface designed for individuals at any financial modeling skill level.
Who Can Benefit from Cowell e Holdings Inc. (1415HK)?
- Investors: Gain assured insights with a top-tier valuation tool tailored for precision.
- Financial Analysts: Streamline your workflow with a customizable DCF model at your fingertips.
- Consultants: Effortlessly modify the template for impactful client presentations or comprehensive reports.
- Finance Enthusiasts: Enhance your knowledge of valuation methodologies through practical, real-life examples.
- Educators and Students: Utilize this resource as an effective hands-on learning aid in finance courses.
Contents of the Template
- Operating and Balance Sheet Data: Pre-filled historical data and forecasts for Cowell e Holdings Inc. (1415HK), covering revenue, EBITDA, EBIT, and capital expenditures.
- WACC Calculation: A specialized sheet for calculating the Weighted Average Cost of Capital (WACC), featuring parameters such as Beta, risk-free rate, and share price.
- DCF Valuation (Unlevered and Levered): Customizable Discounted Cash Flow models illustrating intrinsic value with comprehensive calculations.
- Financial Statements: Pre-loaded annual and quarterly financial statements to facilitate in-depth analysis.
- Key Ratios: A collection of profitability, leverage, and efficiency ratios specific to Cowell e Holdings Inc. (1415HK).
- Dashboard and Charts: A visual overview of valuation outputs and assumptions, designed for easy result analysis.
Disclaimer
All information, articles, and product details provided on this website are for general informational and educational purposes only. We do not claim any ownership over, nor do we intend to infringe upon, any trademarks, copyrights, logos, brand names, or other intellectual property mentioned or depicted on this site. Such intellectual property remains the property of its respective owners, and any references here are made solely for identification or informational purposes, without implying any affiliation, endorsement, or partnership.
We make no representations or warranties, express or implied, regarding the accuracy, completeness, or suitability of any content or products presented. Nothing on this website should be construed as legal, tax, investment, financial, medical, or other professional advice. In addition, no part of this site—including articles or product references—constitutes a solicitation, recommendation, endorsement, advertisement, or offer to buy or sell any securities, franchises, or other financial instruments, particularly in jurisdictions where such activity would be unlawful.
All content is of a general nature and may not address the specific circumstances of any individual or entity. It is not a substitute for professional advice or services. Any actions you take based on the information provided here are strictly at your own risk. You accept full responsibility for any decisions or outcomes arising from your use of this website and agree to release us from any liability in connection with your use of, or reliance upon, the content or products found herein.