
|
Fu Shou Yuan International Group Limited (1448.HK) DCF Valuation |
Fully Editable: Tailor To Your Needs In Excel Or Sheets
Professional Design: Trusted, Industry-Standard Templates
Investor-Approved Valuation Models
MAC/PC Compatible, Fully Unlocked
No Expertise Is Needed; Easy To Follow
Fu Shou Yuan International Group Limited (1448.HK) Bundle
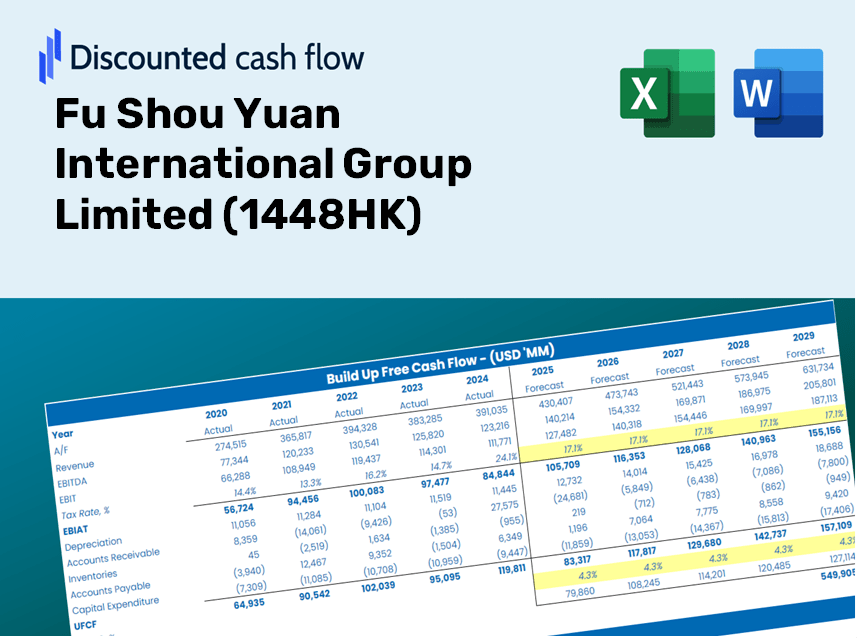
Simplify Fu Shou Yuan International Group Limited (1448HK) valuation with this customizable DCF Calculator! Featuring real Fu Shou Yuan International Group Limited (1448HK) financials and adjustable forecast inputs, you can test scenarios and uncover Fu Shou Yuan International Group Limited (1448HK) fair value in minutes.
Discounted Cash Flow (DCF) - (USD MM)
| Year | AY1 2020 |
AY2 2021 |
AY3 2022 |
AY4 2023 |
AY5 2024 |
FY1 2025 |
FY2 2026 |
FY3 2027 |
FY4 2028 |
FY5 2029 |
|---|---|---|---|---|---|---|---|---|---|---|
| Revenue | 2,069.3 | 2,543.1 | 2,374.5 | 2,873.5 | 2,271.5 | 2,364.3 | 2,460.8 | 2,561.3 | 2,665.9 | 2,774.7 |
| Revenue Growth, % | 0 | 22.9 | -6.63 | 21.02 | -20.95 | 4.08 | 4.08 | 4.08 | 4.08 | 4.08 |
| EBITDA | 1,133.4 | 1,326.4 | 1,262.7 | 1,651.5 | 1,057.9 | 1,249.0 | 1,300.0 | 1,353.1 | 1,408.4 | 1,465.9 |
| EBITDA, % | 54.77 | 52.16 | 53.18 | 57.48 | 46.57 | 52.83 | 52.83 | 52.83 | 52.83 | 52.83 |
| Depreciation | 118.8 | 129.7 | 136.1 | 151.2 | 167.8 | 138.2 | 143.8 | 149.7 | 155.8 | 162.2 |
| Depreciation, % | 5.74 | 5.1 | 5.73 | 5.26 | 7.38 | 5.84 | 5.84 | 5.84 | 5.84 | 5.84 |
| EBIT | 1,014.6 | 1,196.7 | 1,126.6 | 1,500.4 | 890.1 | 1,110.9 | 1,156.2 | 1,203.5 | 1,252.6 | 1,303.7 |
| EBIT, % | 49.03 | 47.06 | 47.44 | 52.21 | 39.19 | 46.99 | 46.99 | 46.99 | 46.99 | 46.99 |
| Total Cash | 2,424.0 | 2,544.6 | 2,693.7 | 3,542.3 | 3,098.9 | 2,364.3 | 2,460.8 | 2,561.3 | 2,665.9 | 2,774.7 |
| Total Cash, percent | .0 | .0 | .0 | .0 | .0 | .0 | .0 | .0 | .0 | .0 |
| Account Receivables | 69.2 | 123.5 | 162.8 | 166.8 | 146.9 | 129.2 | 134.5 | 140.0 | 145.7 | 151.7 |
| Account Receivables, % | 3.34 | 4.86 | 6.86 | 5.81 | 6.47 | 5.47 | 5.47 | 5.47 | 5.47 | 5.47 |
| Inventories | 549.2 | 595.3 | 611.2 | 610.1 | 630.2 | 589.5 | 613.5 | 638.6 | 664.7 | 691.8 |
| Inventories, % | 26.54 | 23.41 | 25.74 | 21.23 | 27.74 | 24.93 | 24.93 | 24.93 | 24.93 | 24.93 |
| Accounts Payable | 268.2 | 308.1 | 337.4 | 335.5 | 349.6 | 313.7 | 326.6 | 339.9 | 353.8 | 368.2 |
| Accounts Payable, % | 12.96 | 12.11 | 14.21 | 11.68 | 15.39 | 13.27 | 13.27 | 13.27 | 13.27 | 13.27 |
| Capital Expenditure | -116.4 | -192.0 | -93.0 | -48.8 | -86.5 | -106.9 | -111.2 | -115.8 | -120.5 | -125.4 |
| Capital Expenditure, % | -5.62 | -7.55 | -3.92 | -1.7 | -3.81 | -4.52 | -4.52 | -4.52 | -4.52 | -4.52 |
| Tax Rate, % | 53.96 | 53.96 | 53.96 | 53.96 | 53.96 | 53.96 | 53.96 | 53.96 | 53.96 | 53.96 |
| EBITAT | 641.9 | 730.7 | 679.3 | 829.3 | 409.8 | 635.3 | 661.2 | 688.2 | 716.3 | 745.6 |
| Depreciation | ||||||||||
| Changes in Account Receivables | ||||||||||
| Changes in Inventories | ||||||||||
| Changes in Accounts Payable | ||||||||||
| Capital Expenditure | ||||||||||
| UFCF | 294.2 | 607.7 | 696.6 | 926.8 | 505.0 | 689.1 | 677.3 | 704.9 | 733.7 | 763.7 |
| WACC, % | 6.59 | 6.59 | 6.59 | 6.57 | 6.55 | 6.58 | 6.58 | 6.58 | 6.58 | 6.58 |
| PV UFCF | ||||||||||
| SUM PV UFCF | 2,949.1 | |||||||||
| Long Term Growth Rate, % | 0.50 | |||||||||
| Free cash flow (T + 1) | 767 | |||||||||
| Terminal Value | 12,627 | |||||||||
| Present Terminal Value | 9,182 | |||||||||
| Enterprise Value | 12,131 | |||||||||
| Net Debt | -2,072 | |||||||||
| Equity Value | 14,203 | |||||||||
| Diluted Shares Outstanding, MM | 2,271 | |||||||||
| Equity Value Per Share | 6.25 |
What You Will Receive
- Genuine 1448HK Financials: Access to historical and projected data for precise valuation.
- Customizable Inputs: Adjust WACC, tax rates, revenue growth, and capital expenditures to fit your analysis.
- Automated Calculations: Dynamic computation of intrinsic value and NPV at your fingertips.
- Scenario Testing: Evaluate multiple scenarios to forecast Fu Shou Yuan’s future performance.
- User-Friendly Design: Designed for industry professionals while remaining approachable for newcomers.
Key Features
- Authentic Financial Data: Gain access to reliable historical performance metrics and future forecasts for Fu Shou Yuan International Group Limited (1448HK).
- Tailorable Projection Parameters: Modify highlighted fields to adjust assumptions like WACC, growth percentages, and profit margins.
- Adaptive Calculations: Enjoy real-time updates for DCF, Net Present Value (NPV), and cash flow assessments.
- Interactive Dashboard: Clear and informative charts that make it easy to interpret your valuation outcomes.
- Suited for All Experience Levels: A user-friendly design catering to investors, CFOs, and consultants, whether novice or expert.
How It Works
- Download: Obtain the pre-configured Excel file featuring Fu Shou Yuan International Group Limited's (1448HK) financial data.
- Customize: Modify forecasts such as revenue growth, EBITDA %, and WACC to fit your analysis.
- Update Automatically: Enjoy real-time updates for intrinsic value and NPV calculations.
- Test Scenarios: Develop various projections and instantly compare the results.
- Make Decisions: Leverage the valuation outcomes to shape your investment approach.
Why Opt for Fu Shou Yuan International Group Limited (1448HK) Calculator?
- Precision: Utilizes real financial data for unmatched accuracy.
- Adaptability: Allows users to easily experiment with and adjust inputs.
- Efficiency: Eliminate the need to create a DCF model from the ground up.
- Expert-Level: Crafted with the insight and detail expected by CFOs.
- Intuitive: Simple interface designed for users of all financial backgrounds.
Who Would Benefit from This Product?
- Investors: Accurately assess the fair value of Fu Shou Yuan International Group Limited (1448HK) prior to making investment choices.
- CFOs: Utilize a high-quality DCF model for comprehensive financial analysis and reporting.
- Consultants: Easily customize the template for client valuation reports.
- Entrepreneurs: Obtain valuable insights into financial modeling practices employed by leading corporations.
- Educators: Employ this resource as a teaching aid to illustrate various valuation techniques.
Contents of the Template
- Pre-Filled Data: Contains Fu Shou Yuan International Group Limited's historical financials and future projections.
- Discounted Cash Flow Model: An editable DCF valuation model featuring automated calculations.
- Weighted Average Cost of Capital (WACC): A specific sheet for calculating WACC based on user-defined inputs.
- Key Financial Ratios: Examine profitability, efficiency, and financial leverage of Fu Shou Yuan International Group Limited.
- Customizable Inputs: Easily modify revenue growth rates, profit margins, and tax rates.
- User-Friendly Dashboard: Visual representations and tables that summarize essential valuation outputs.
Disclaimer
All information, articles, and product details provided on this website are for general informational and educational purposes only. We do not claim any ownership over, nor do we intend to infringe upon, any trademarks, copyrights, logos, brand names, or other intellectual property mentioned or depicted on this site. Such intellectual property remains the property of its respective owners, and any references here are made solely for identification or informational purposes, without implying any affiliation, endorsement, or partnership.
We make no representations or warranties, express or implied, regarding the accuracy, completeness, or suitability of any content or products presented. Nothing on this website should be construed as legal, tax, investment, financial, medical, or other professional advice. In addition, no part of this site—including articles or product references—constitutes a solicitation, recommendation, endorsement, advertisement, or offer to buy or sell any securities, franchises, or other financial instruments, particularly in jurisdictions where such activity would be unlawful.
All content is of a general nature and may not address the specific circumstances of any individual or entity. It is not a substitute for professional advice or services. Any actions you take based on the information provided here are strictly at your own risk. You accept full responsibility for any decisions or outcomes arising from your use of this website and agree to release us from any liability in connection with your use of, or reliance upon, the content or products found herein.