
|
Inpex Corporation (1605.T) DCF Valuation |
Fully Editable: Tailor To Your Needs In Excel Or Sheets
Professional Design: Trusted, Industry-Standard Templates
Investor-Approved Valuation Models
MAC/PC Compatible, Fully Unlocked
No Expertise Is Needed; Easy To Follow
Inpex Corporation (1605.T) Bundle
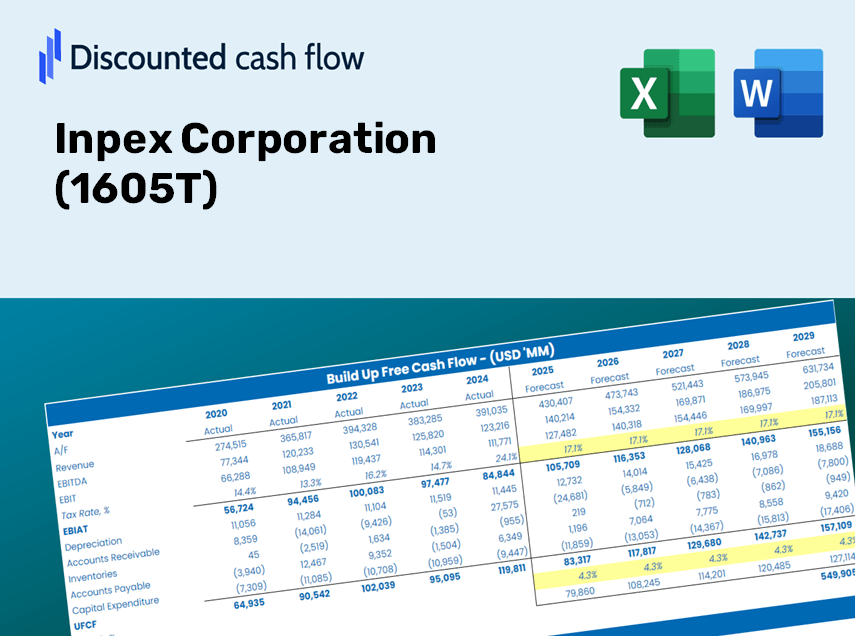
Explore Inpex Corporation's (1605T) financial prospects with our user-friendly DCF Calculator! Enter your assumptions for growth, margins, and costs to calculate Inpex Corporation's (1605T) intrinsic value and inform your investment strategy.
Discounted Cash Flow (DCF) - (USD MM)
| Year | AY1 2020 |
AY2 2021 |
AY3 2022 |
AY4 2023 |
AY5 2024 |
FY1 2025 |
FY2 2026 |
FY3 2027 |
FY4 2028 |
FY5 2029 |
|---|---|---|---|---|---|---|---|---|---|---|
| Revenue | 771,046.0 | 1,244,369.0 | 2,324,660.0 | 2,164,516.0 | 2,265,837.0 | 2,054,343.3 | 1,862,590.5 | 1,688,735.9 | 1,531,109.0 | 1,388,195.0 |
| Revenue Growth, % | 0 | 61.39 | 86.81 | -6.89 | 4.68 | -9.33 | -9.33 | -9.33 | -9.33 | -9.33 |
| EBITDA | 267,344.0 | 867,244.0 | 1,631,813.0 | 1,632,719.0 | 1,526,190.0 | 1,303,891.1 | 1,182,185.6 | 1,071,840.2 | 971,794.4 | 881,086.9 |
| EBITDA, % | 34.67 | 69.69 | 70.2 | 75.43 | 67.36 | 63.47 | 63.47 | 63.47 | 63.47 | 63.47 |
| Depreciation | 180,858.0 | 210,040.0 | 314,313.0 | 331,734.0 | 359,230.0 | 349,388.1 | 316,776.1 | 287,208.2 | 260,400.1 | 236,094.3 |
| Depreciation, % | 23.46 | 16.88 | 13.52 | 15.33 | 15.85 | 17.01 | 17.01 | 17.01 | 17.01 | 17.01 |
| EBIT | 86,486.0 | 657,204.0 | 1,317,500.0 | 1,300,985.0 | 1,166,960.0 | 954,503.0 | 865,409.5 | 784,632.0 | 711,394.3 | 644,992.6 |
| EBIT, % | 11.22 | 52.81 | 56.67 | 60.11 | 51.5 | 46.46 | 46.46 | 46.46 | 46.46 | 46.46 |
| Total Cash | 182,978.0 | 201,765.0 | 285,981.0 | 201,149.0 | 241,675.0 | 296,673.9 | 268,982.3 | 243,875.4 | 221,112.0 | 200,473.4 |
| Total Cash, percent | .0 | .0 | .0 | .0 | .0 | .0 | .0 | .0 | .0 | .0 |
| Account Receivables | 112,333.0 | 198,429.0 | 239,918.0 | 274,367.0 | 313,135.0 | 276,642.6 | 250,820.7 | 227,409.0 | 206,182.6 | 186,937.5 |
| Account Receivables, % | 14.57 | 15.95 | 10.32 | 12.68 | 13.82 | 13.47 | 13.47 | 13.47 | 13.47 | 13.47 |
| Inventories | 34,299.0 | 47,817.0 | 68,154.0 | 69,856.0 | 67,241.0 | 71,564.1 | 64,884.3 | 58,828.0 | 53,337.0 | 48,358.5 |
| Inventories, % | 4.45 | 3.84 | 2.93 | 3.23 | 2.97 | 3.48 | 3.48 | 3.48 | 3.48 | 3.48 |
| Accounts Payable | 15,090.0 | 14,888.0 | 47,183.0 | 207,913.0 | 192,576.0 | 95,682.3 | 86,751.3 | 78,653.9 | 71,312.4 | 64,656.1 |
| Accounts Payable, % | 1.96 | 1.2 | 2.03 | 9.61 | 8.5 | 4.66 | 4.66 | 4.66 | 4.66 | 4.66 |
| Capital Expenditure | -138,885.0 | -150,968.0 | -196,666.0 | -252,134.0 | -301,061.0 | -261,066.4 | -236,698.4 | -214,604.9 | -194,573.7 | -176,412.1 |
| Capital Expenditure, % | -18.01 | -12.13 | -8.46 | -11.65 | -13.29 | -12.71 | -12.71 | -12.71 | -12.71 | -12.71 |
| Tax Rate, % | 67.1 | 67.1 | 67.1 | 67.1 | 67.1 | 67.1 | 67.1 | 67.1 | 67.1 | 67.1 |
| EBITAT | -143,342.1 | 227,813.3 | 464,946.6 | 333,926.4 | 383,961.4 | 245,353.0 | 222,451.7 | 201,688.0 | 182,862.4 | 165,794.0 |
| Depreciation | ||||||||||
| Changes in Account Receivables | ||||||||||
| Changes in Inventories | ||||||||||
| Changes in Accounts Payable | ||||||||||
| Capital Expenditure | ||||||||||
| UFCF | -232,911.1 | 187,069.3 | 553,062.6 | 538,105.4 | 390,640.4 | 268,950.4 | 326,100.1 | 295,661.9 | 268,064.7 | 243,043.5 |
| WACC, % | 3.81 | 4.79 | 4.81 | 4.54 | 4.74 | 4.54 | 4.54 | 4.54 | 4.54 | 4.54 |
| PV UFCF | ||||||||||
| SUM PV UFCF | 1,233,640.3 | |||||||||
| Long Term Growth Rate, % | 0.50 | |||||||||
| Free cash flow (T + 1) | 244,259 | |||||||||
| Terminal Value | 6,049,852 | |||||||||
| Present Terminal Value | 4,846,024 | |||||||||
| Enterprise Value | 6,079,665 | |||||||||
| Net Debt | 822,236 | |||||||||
| Equity Value | 5,257,429 | |||||||||
| Diluted Shares Outstanding, MM | 1,238 | |||||||||
| Equity Value Per Share | 4,245.25 |
What You Will Gain
- Authentic INPEX Financials: Access historical and projected data for precise valuation.
- Customizable Inputs: Adjust WACC, tax rates, revenue growth, and capital expenditures as needed.
- Real-Time Calculations: Intrinsic value and NPV are computed on-the-fly.
- Scenario Analysis: Explore various scenarios to assess INPEX's future performance.
- User-Friendly Design: Designed for professionals, yet easy for newcomers to navigate.
Key Features
- Customizable Forecast Inputs: Adjust essential variables such as revenue growth, EBITDA percentage, and capital expenditures.
- Instant DCF Valuation: Automatically computes intrinsic value, NPV, and additional metrics at the click of a button.
- High-Level Accuracy: Leverages Inpex Corporation’s (1605T) actual financial data for dependable valuation results.
- Streamlined Scenario Analysis: Effortlessly explore various assumptions and evaluate the resulting impacts.
- Efficiency Booster: Remove the hassle of creating intricate valuation models from the ground up.
How It Operates
- Obtain the Template: Gain immediate access to the Excel-based Inpex Corporation (1605T) DCF Calculator.
- Enter Your Assumptions: Modify the yellow-highlighted cells for growth rates, WACC, profit margins, and additional parameters.
- Automatic Calculations: The model swiftly recalculates Inpex's intrinsic value based on your inputs.
- Experiment with Scenarios: Assess various assumptions to see how they impact the valuation outcomes.
- Evaluate and Decide: Leverage the findings to inform your investment or financial decision-making process.
Why Choose This Calculator for Inpex Corporation (1605T)?
- Comprehensive Tool: Combines DCF, WACC, and financial ratio analyses into a single resource.
- Customizable Inputs: Modify the yellow-highlighted cells to explore different scenarios.
- Detailed Insights: Automatically computes Inpex Corporation’s intrinsic value and Net Present Value.
- Preloaded Data: Historical and forecasted information provides accurate starting points for analysis.
- Professional Quality: Perfect for financial analysts, investors, and business consultants focusing on Inpex Corporation (1605T).
Who Can Benefit from This Product?
- Investors: Evaluate Inpex Corporation’s (1605T) valuation before making investment decisions.
- CFOs and Financial Analysts: Optimize valuation methodologies and validate forecasts for Inpex Corporation (1605T).
- Startup Founders: Understand the valuation principles of established firms like Inpex Corporation (1605T).
- Consultants: Create detailed valuation reports for your clients focusing on Inpex Corporation (1605T).
- Students and Educators: Utilize authentic market data from Inpex Corporation (1605T) to enhance learning and teaching of valuation strategies.
What the Template Contains
- Operating and Balance Sheet Data: Pre-filled Inpex Corporation (1605T) historical data and forecasts, including revenue, EBITDA, EBIT, and capital expenditures.
- WACC Calculation: A dedicated sheet for Weighted Average Cost of Capital (WACC), featuring parameters like Beta, risk-free rate, and share price.
- DCF Valuation (Unlevered and Levered): Editable Discounted Cash Flow models that display intrinsic value with comprehensive calculations.
- Financial Statements: Pre-loaded financial statements (annual and quarterly) to facilitate thorough analysis.
- Key Ratios: Includes profitability, leverage, and efficiency ratios specifically for Inpex Corporation (1605T).
- Dashboard and Charts: Visual summary of valuation outputs and assumptions, designed for easy analysis of results.
Disclaimer
All information, articles, and product details provided on this website are for general informational and educational purposes only. We do not claim any ownership over, nor do we intend to infringe upon, any trademarks, copyrights, logos, brand names, or other intellectual property mentioned or depicted on this site. Such intellectual property remains the property of its respective owners, and any references here are made solely for identification or informational purposes, without implying any affiliation, endorsement, or partnership.
We make no representations or warranties, express or implied, regarding the accuracy, completeness, or suitability of any content or products presented. Nothing on this website should be construed as legal, tax, investment, financial, medical, or other professional advice. In addition, no part of this site—including articles or product references—constitutes a solicitation, recommendation, endorsement, advertisement, or offer to buy or sell any securities, franchises, or other financial instruments, particularly in jurisdictions where such activity would be unlawful.
All content is of a general nature and may not address the specific circumstances of any individual or entity. It is not a substitute for professional advice or services. Any actions you take based on the information provided here are strictly at your own risk. You accept full responsibility for any decisions or outcomes arising from your use of this website and agree to release us from any liability in connection with your use of, or reliance upon, the content or products found herein.