
|
Metallurgical Corporation of China Ltd. (1618.HK) DCF Valuation |
Fully Editable: Tailor To Your Needs In Excel Or Sheets
Professional Design: Trusted, Industry-Standard Templates
Investor-Approved Valuation Models
MAC/PC Compatible, Fully Unlocked
No Expertise Is Needed; Easy To Follow
Metallurgical Corporation of China Ltd. (1618.HK) Bundle
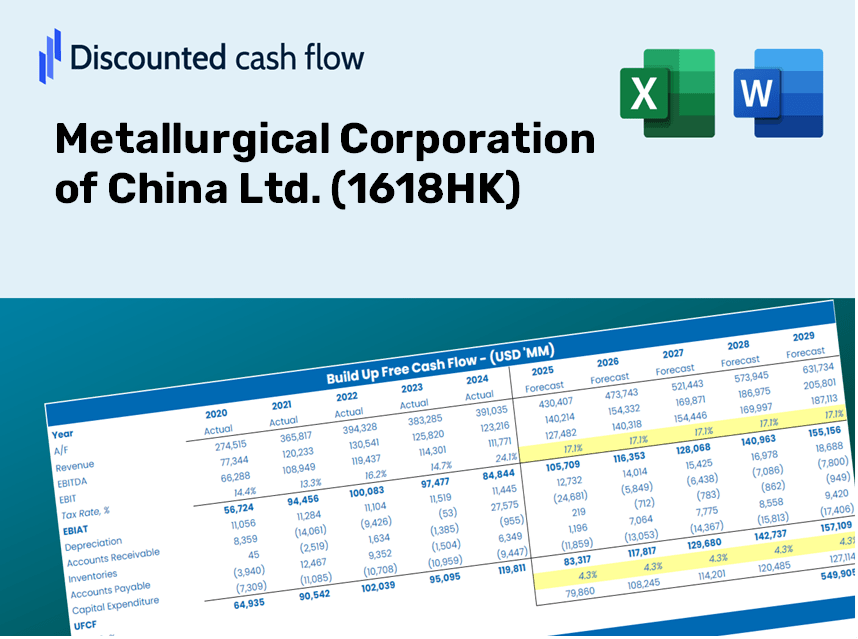
Gain insights into your Metallurgical Corporation of China Ltd. (1618HK) valuation analysis with our sophisticated DCF Calculator! Designed with real (1618HK) data at your fingertips, this Excel template enables you to modify forecasts and assumptions to accurately determine the intrinsic value of Metallurgical Corporation of China Ltd.
Discounted Cash Flow (DCF) - (USD MM)
| Year | AY1 2020 |
AY2 2021 |
AY3 2022 |
AY4 2023 |
AY5 2024 |
FY1 2025 |
FY2 2026 |
FY3 2027 |
FY4 2028 |
FY5 2029 |
|---|---|---|---|---|---|---|---|---|---|---|
| Revenue | 438,433.7 | 548,511.6 | 649,429.2 | 694,576.4 | 604,892.2 | 661,669.3 | 723,775.7 | 791,711.6 | 866,024.2 | 947,312.0 |
| Revenue Growth, % | 0 | 25.11 | 18.4 | 6.95 | -12.91 | 9.39 | 9.39 | 9.39 | 9.39 | 9.39 |
| EBITDA | 19,685.0 | 21,487.6 | 23,979.9 | 22,292.5 | 18,633.9 | 24,335.9 | 26,620.2 | 29,118.8 | 31,852.0 | 34,841.7 |
| EBITDA, % | 4.49 | 3.92 | 3.69 | 3.21 | 3.08 | 3.68 | 3.68 | 3.68 | 3.68 | 3.68 |
| Depreciation | 3,876.1 | 3,788.0 | 4,228.4 | 4,313.0 | 4,808.9 | 4,819.2 | 5,271.6 | 5,766.4 | 6,307.7 | 6,899.7 |
| Depreciation, % | 0.88407 | 0.6906 | 0.6511 | 0.62096 | 0.795 | 0.72835 | 0.72835 | 0.72835 | 0.72835 | 0.72835 |
| EBIT | 15,808.9 | 17,699.6 | 19,751.5 | 17,979.5 | 13,825.0 | 19,516.7 | 21,348.6 | 23,352.4 | 25,544.4 | 27,942.0 |
| EBIT, % | 3.61 | 3.23 | 3.04 | 2.59 | 2.29 | 2.95 | 2.95 | 2.95 | 2.95 | 2.95 |
| Total Cash | 60,647.3 | 45,831.2 | 50,036.6 | 48,698.5 | 57,595.5 | 61,437.1 | 67,203.8 | 73,511.8 | 80,411.8 | 87,959.5 |
| Total Cash, percent | .0 | .0 | .0 | .0 | .0 | .0 | .0 | .0 | .0 | .0 |
| Account Receivables | 295,511.2 | 333,489.8 | 328,911.2 | 338,617.5 | 466,190.5 | 403,179.6 | 441,023.3 | 482,419.2 | 527,700.6 | 577,232.2 |
| Account Receivables, % | 67.4 | 60.8 | 50.65 | 48.75 | 77.07 | 60.93 | 60.93 | 60.93 | 60.93 | 60.93 |
| Inventories | 66,383.3 | 67,770.7 | 87,605.3 | 87,744.4 | 82,832.7 | 89,077.3 | 97,438.4 | 106,584.3 | 116,588.6 | 127,532.0 |
| Inventories, % | 15.14 | 12.36 | 13.49 | 12.63 | 13.69 | 13.46 | 13.46 | 13.46 | 13.46 | 13.46 |
| Accounts Payable | 179,919.7 | 211,353.9 | 245,832.3 | 298,171.4 | 400,210.9 | 299,754.2 | 327,890.1 | 358,666.9 | 392,332.6 | 429,158.1 |
| Accounts Payable, % | 41.04 | 38.53 | 37.85 | 42.93 | 66.16 | 45.3 | 45.3 | 45.3 | 45.3 | 45.3 |
| Capital Expenditure | -4,101.5 | -3,891.5 | -4,727.1 | -5,035.4 | -7,519.9 | -5,744.6 | -6,283.8 | -6,873.6 | -7,518.8 | -8,224.5 |
| Capital Expenditure, % | -0.93549 | -0.70947 | -0.72788 | -0.72496 | -1.24 | -0.8682 | -0.8682 | -0.8682 | -0.8682 | -0.8682 |
| Tax Rate, % | 27.11 | 27.11 | 27.11 | 27.11 | 27.11 | 27.11 | 27.11 | 27.11 | 27.11 | 27.11 |
| EBITAT | 10,429.6 | 14,661.7 | 13,186.6 | 11,325.2 | 10,077.5 | 13,718.5 | 15,006.1 | 16,414.7 | 17,955.4 | 19,640.8 |
| Depreciation | ||||||||||
| Changes in Account Receivables | ||||||||||
| Changes in Inventories | ||||||||||
| Changes in Accounts Payable | ||||||||||
| Capital Expenditure | ||||||||||
| UFCF | -171,770.7 | 6,626.5 | 31,910.3 | 53,096.7 | -13,255.3 | -30,897.2 | -4,075.0 | -4,457.5 | -4,875.8 | -5,333.5 |
| WACC, % | 5.04 | 5.5 | 5.06 | 4.95 | 5.23 | 5.15 | 5.15 | 5.15 | 5.15 | 5.15 |
| PV UFCF | ||||||||||
| SUM PV UFCF | -45,037.9 | |||||||||
| Long Term Growth Rate, % | 2.00 | |||||||||
| Free cash flow (T + 1) | -5,440 | |||||||||
| Terminal Value | -172,475 | |||||||||
| Present Terminal Value | -134,151 | |||||||||
| Enterprise Value | -179,189 | |||||||||
| Net Debt | 28,522 | |||||||||
| Equity Value | -207,711 | |||||||||
| Diluted Shares Outstanding, MM | 20,724 | |||||||||
| Equity Value Per Share | -10.02 |
Benefits You Will Receive
- Accurate 1618HK Financial Data: Provides both historical and projected figures for precise valuation.
- Customizable Parameters: Adjust inputs like WACC, tax rates, revenue growth, and capital expenditures.
- Automatic Calculations: Intrinsic value and NPV are computed in real-time.
- Scenario Analysis: Explore various scenarios to assess Metallurgical Corporation of China's future outlook.
- User-Friendly Design: Designed for professionals while remaining approachable for newcomers.
Key Features
- 🔍 Real-Life MCC Financials: Pre-filled historical and projected data for Metallurgical Corporation of China Ltd. (1618HK).
- ✏️ Fully Customizable Inputs: Modify all essential parameters (yellow cells) such as WACC, growth %, and tax rates.
- 📊 Professional DCF Valuation: Integrated formulas assess the intrinsic value of MCC using the Discounted Cash Flow method.
- ⚡ Instant Results: Visualize MCC's valuation immediately after adjustments are made.
- Scenario Analysis: Evaluate and compare results for different financial assumptions side-by-side.
How It Works
- Step 1: Download the ready-to-use Excel template that includes Metallurgical Corporation of China Ltd.'s (1618HK) data.
- Step 2: Navigate through the pre-filled sheets to familiarize yourself with the essential metrics.
- Step 3: Modify forecasts and assumptions in the editable yellow cells (WACC, growth, margins).
- Step 4: Instantly view the updated results, including the intrinsic value of Metallurgical Corporation of China Ltd. (1618HK).
- Step 5: Use the outputs to make well-informed investment choices or create detailed reports.
Why Choose This Calculator for Metallurgical Corporation of China Ltd. (1618HK)?
- Save Time: Skip the hassle of building a DCF model from the ground up – it's ready for immediate use.
- Enhance Accuracy: Dependable financial data and formulas minimize valuation errors.
- Fully Customizable: Adjust the model to align with your unique assumptions and forecasts.
- Easy to Understand: Intuitive charts and outputs simplify result analysis.
- Trusted by Professionals: Crafted for experts who prioritize precision and user-friendliness.
Who Should Use This Product?
- Investors: Accurately assess the fair value of Metallurgical Corporation of China Ltd. (1618HK) before making investment choices.
- CFOs: Utilize a professional-grade DCF model tailored for financial reporting and analysis.
- Consultants: Easily customize the template for valuation reports tailored to clients.
- Entrepreneurs: Acquire insights into financial modeling practices employed by leading corporations.
- Educators: Employ it as a teaching resource to illustrate valuation techniques.
Contents of the Template
- Historical Data: Provides Metallurgical Corporation of China's past financial performance and foundational forecasts.
- DCF and Levered DCF Models: Comprehensive templates to determine the intrinsic value of Metallurgical Corporation of China.
- WACC Sheet: Pre-calculated metrics for the Weighted Average Cost of Capital.
- Editable Inputs: Adjust essential factors such as growth rates, EBITDA percentages, and CAPEX projections.
- Quarterly and Annual Statements: A thorough analysis of Metallurgical Corporation of China's financials.
- Interactive Dashboard: Dynamically visualize valuation outcomes and future projections.
Disclaimer
All information, articles, and product details provided on this website are for general informational and educational purposes only. We do not claim any ownership over, nor do we intend to infringe upon, any trademarks, copyrights, logos, brand names, or other intellectual property mentioned or depicted on this site. Such intellectual property remains the property of its respective owners, and any references here are made solely for identification or informational purposes, without implying any affiliation, endorsement, or partnership.
We make no representations or warranties, express or implied, regarding the accuracy, completeness, or suitability of any content or products presented. Nothing on this website should be construed as legal, tax, investment, financial, medical, or other professional advice. In addition, no part of this site—including articles or product references—constitutes a solicitation, recommendation, endorsement, advertisement, or offer to buy or sell any securities, franchises, or other financial instruments, particularly in jurisdictions where such activity would be unlawful.
All content is of a general nature and may not address the specific circumstances of any individual or entity. It is not a substitute for professional advice or services. Any actions you take based on the information provided here are strictly at your own risk. You accept full responsibility for any decisions or outcomes arising from your use of this website and agree to release us from any liability in connection with your use of, or reliance upon, the content or products found herein.