
|
Japan Petroleum Exploration Co., Ltd. (1662.T) DCF Valuation |
Fully Editable: Tailor To Your Needs In Excel Or Sheets
Professional Design: Trusted, Industry-Standard Templates
Investor-Approved Valuation Models
MAC/PC Compatible, Fully Unlocked
No Expertise Is Needed; Easy To Follow
Japan Petroleum Exploration Co., Ltd. (1662.T) Bundle
Discover the true potential of Japan Petroleum Exploration Co., Ltd. (1662T) with our advanced DCF Calculator! Adjust key assumptions, explore various scenarios, and assess how changes affect the valuation of Japan Petroleum Exploration Co., Ltd. (1662T) – all within a single Excel template.
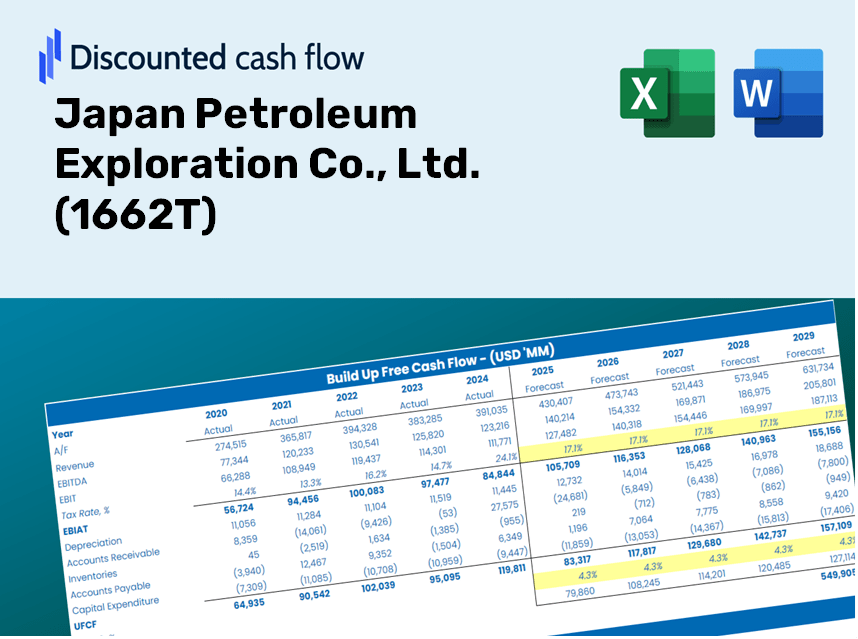
Discounted Cash Flow (DCF) - (USD MM)
| Year | AY1 2021 |
AY2 2022 |
AY3 2023 |
AY4 2024 |
AY5 2025 |
FY1 2026 |
FY2 2027 |
FY3 2028 |
FY4 2029 |
FY5 2030 |
|---|---|---|---|---|---|---|---|---|---|---|
| Revenue | 240,078.0 | 249,140.0 | 336,492.0 | 325,863.0 | 389,082.0 | 442,656.4 | 503,607.7 | 572,951.6 | 651,843.8 | 741,599.0 |
| Revenue Growth, % | 0 | 3.77 | 35.06 | -3.16 | 19.4 | 13.77 | 13.77 | 13.77 | 13.77 | 13.77 |
| EBITDA | 17,808.0 | 407.0 | 97,346.0 | 97,058.0 | 161,169.0 | 95,364.5 | 108,495.6 | 123,434.9 | 140,431.2 | 159,767.7 |
| EBITDA, % | 7.42 | 0.16336 | 28.93 | 29.78 | 41.42 | 21.54 | 21.54 | 21.54 | 21.54 | 21.54 |
| Depreciation | 22,599.0 | 17,721.0 | 14,257.0 | 27,646.0 | 49,906.0 | 37,248.2 | 42,377.1 | 48,212.2 | 54,850.8 | 62,403.4 |
| Depreciation, % | 9.41 | 7.11 | 4.24 | 8.48 | 12.83 | 8.41 | 8.41 | 8.41 | 8.41 | 8.41 |
| EBIT | -4,791.0 | -17,314.0 | 83,089.0 | 69,412.0 | 111,263.0 | 58,116.2 | 66,118.5 | 75,222.7 | 85,580.4 | 97,364.3 |
| EBIT, % | -2 | -6.95 | 24.69 | 21.3 | 28.6 | 13.13 | 13.13 | 13.13 | 13.13 | 13.13 |
| Total Cash | 165,398.0 | 150,271.0 | 194,956.0 | 172,997.0 | 142,358.0 | 245,076.0 | 278,821.5 | 317,213.7 | 360,892.2 | 410,585.0 |
| Total Cash, percent | .0 | .0 | .0 | .0 | .0 | .0 | .0 | .0 | .0 | .0 |
| Account Receivables | 39,481.0 | 47,563.0 | 47,563.0 | 41,610.0 | 44,493.0 | 65,402.9 | 74,408.5 | 84,654.1 | 96,310.5 | 109,571.9 |
| Account Receivables, % | 16.45 | 19.09 | 14.13 | 12.77 | 11.44 | 14.78 | 14.78 | 14.78 | 14.78 | 14.78 |
| Inventories | 12,438.0 | 14,675.0 | 23,840.0 | 22,527.0 | 17,762.0 | 26,235.4 | 29,847.9 | 33,957.8 | 38,633.6 | 43,953.2 |
| Inventories, % | 5.18 | 5.89 | 7.08 | 6.91 | 4.57 | 5.93 | 5.93 | 5.93 | 5.93 | 5.93 |
| Accounts Payable | 21,546.0 | 11,479.0 | 26,489.0 | 9,520.0 | 11,150.0 | 24,117.1 | 27,437.9 | 31,215.9 | 35,514.2 | 40,404.3 |
| Accounts Payable, % | 8.97 | 4.61 | 7.87 | 2.92 | 2.87 | 5.45 | 5.45 | 5.45 | 5.45 | 5.45 |
| Capital Expenditure | -15,569.0 | -16,568.0 | -36,164.0 | -65,924.0 | -90,531.0 | -59,653.1 | -67,867.0 | -77,211.9 | -87,843.6 | -99,939.1 |
| Capital Expenditure, % | -6.48 | -6.65 | -10.75 | -20.23 | -23.27 | -13.48 | -13.48 | -13.48 | -13.48 | -13.48 |
| Tax Rate, % | 25.28 | 25.28 | 25.28 | 25.28 | 25.28 | 25.28 | 25.28 | 25.28 | 25.28 | 25.28 |
| EBITAT | -1,783.0 | -28,999.9 | 67,398.1 | 54,150.9 | 83,133.3 | 43,129.7 | 49,068.4 | 55,824.8 | 63,511.6 | 72,256.7 |
| Depreciation | ||||||||||
| Changes in Account Receivables | ||||||||||
| Changes in Inventories | ||||||||||
| Changes in Accounts Payable | ||||||||||
| Capital Expenditure | ||||||||||
| UFCF | -25,126.0 | -48,232.9 | 51,336.1 | 6,169.9 | 46,020.3 | 4,308.6 | 14,281.2 | 16,247.6 | 18,484.8 | 21,030.1 |
| WACC, % | 4.92 | 5.44 | 5.28 | 5.26 | 5.23 | 5.23 | 5.23 | 5.23 | 5.23 | 5.23 |
| PV UFCF | ||||||||||
| SUM PV UFCF | 62,317.4 | |||||||||
| Long Term Growth Rate, % | 0.50 | |||||||||
| Free cash flow (T + 1) | 21,135 | |||||||||
| Terminal Value | 447,268 | |||||||||
| Present Terminal Value | 346,708 | |||||||||
| Enterprise Value | 409,026 | |||||||||
| Net Debt | -130,934 | |||||||||
| Equity Value | 539,960 | |||||||||
| Diluted Shares Outstanding, MM | 258 | |||||||||
| Equity Value Per Share | 2,095.26 |
What You Will Receive
- Customizable Excel Template: A fully editable Excel-based DCF Calculator featuring pre-loaded financial data for Japan Petroleum Exploration Co., Ltd. (1662T).
- Authentic Data: Access to historical figures and forward-looking projections (highlighted in the yellow cells).
- Flexible Forecasting: Adjust key assumptions such as revenue growth, EBITDA margin, and WACC.
- Instant Calculations: Observe how your changes affect the valuation of Japan Petroleum Exploration Co., Ltd. (1662T) in real-time.
- Professional Resource: Designed for investors, CFOs, consultants, and financial analysts.
- Intuitive Layout: Organized for easy navigation and understanding, complete with step-by-step guidance.
Key Features
- 🔍 Real-Life JPT Financials: Pre-filled historical and projected data for Japan Petroleum Exploration Co., Ltd. (1662T).
- ✏️ Fully Customizable Inputs: Modify all key parameters (yellow cells) such as WACC, growth %, and tax rates.
- 📊 Professional DCF Valuation: Integrated formulas compute JPT’s intrinsic value through the Discounted Cash Flow method.
- ⚡ Instant Results: See JPT’s valuation immediately after making adjustments.
- Scenario Analysis: Evaluate and contrast outcomes for various financial assumptions side-by-side.
How It Functions
- 1. Access the Template: Download and open the Excel file featuring Japan Petroleum Exploration Co., Ltd.'s (1662T) preloaded data.
- 2. Modify Assumptions: Adjust crucial inputs such as growth rates, WACC, and capital expenditures.
- 3. Observe Results Immediately: The DCF model automatically calculates intrinsic value and NPV in real-time.
- 4. Experiment with Scenarios: Analyze various forecasts to evaluate different valuation results.
- 5. Present with Assurance: Deliver professional valuation insights to reinforce your decision-making.
Why Opt for This Calculator?
- Designed for Experts: A sophisticated tool favored by analysts, CFOs, and industry consultants.
- Accurate Data: Japan Petroleum Exploration Co., Ltd.'s (1662T) historical and projected financial information is preloaded for precision.
- Scenario Analysis: Easily simulate various forecasts and assumptions.
- Clear Results: Calculates intrinsic value, NPV, and essential metrics automatically.
- User-Friendly: Step-by-step instructions ensure a smooth experience.
Who Can Benefit from This Product?
- Investors: Evaluate the valuation of Japan Petroleum Exploration Co., Ltd. (1662T) before making stock transactions.
- CFOs and Financial Analysts: Optimize valuation processes and validate forecasts for better decision-making.
- Startup Founders: Discover the valuation methods applied to significant public firms like Japan Petroleum Exploration Co., Ltd. (1662T).
- Consultants: Provide comprehensive valuation reports to your clients with confidence.
- Students and Educators: Utilize real market data for teaching and practicing valuation strategies.
What the Template Includes
- Comprehensive DCF Model: Editable template featuring detailed valuation calculations tailored for Japan Petroleum Exploration Co., Ltd. (1662T).
- Real-World Data: Historical and projected financials for Japan Petroleum Exploration Co., Ltd. (1662T) preloaded for in-depth analysis.
- Customizable Parameters: Modify WACC, growth rates, and tax assumptions to evaluate different scenarios.
- Financial Statements: Complete annual and quarterly breakdowns for enhanced insights into financial performance.
- Key Ratios: Built-in analysis tools for assessing profitability, efficiency, and leverage metrics.
- Dashboard with Visual Outputs: Clear charts and tables providing actionable insights and results.
Disclaimer
All information, articles, and product details provided on this website are for general informational and educational purposes only. We do not claim any ownership over, nor do we intend to infringe upon, any trademarks, copyrights, logos, brand names, or other intellectual property mentioned or depicted on this site. Such intellectual property remains the property of its respective owners, and any references here are made solely for identification or informational purposes, without implying any affiliation, endorsement, or partnership.
We make no representations or warranties, express or implied, regarding the accuracy, completeness, or suitability of any content or products presented. Nothing on this website should be construed as legal, tax, investment, financial, medical, or other professional advice. In addition, no part of this site—including articles or product references—constitutes a solicitation, recommendation, endorsement, advertisement, or offer to buy or sell any securities, franchises, or other financial instruments, particularly in jurisdictions where such activity would be unlawful.
All content is of a general nature and may not address the specific circumstances of any individual or entity. It is not a substitute for professional advice or services. Any actions you take based on the information provided here are strictly at your own risk. You accept full responsibility for any decisions or outcomes arising from your use of this website and agree to release us from any liability in connection with your use of, or reliance upon, the content or products found herein.